
Blog

Consumer Expectations Match Home Price Performance -Case-Shiller
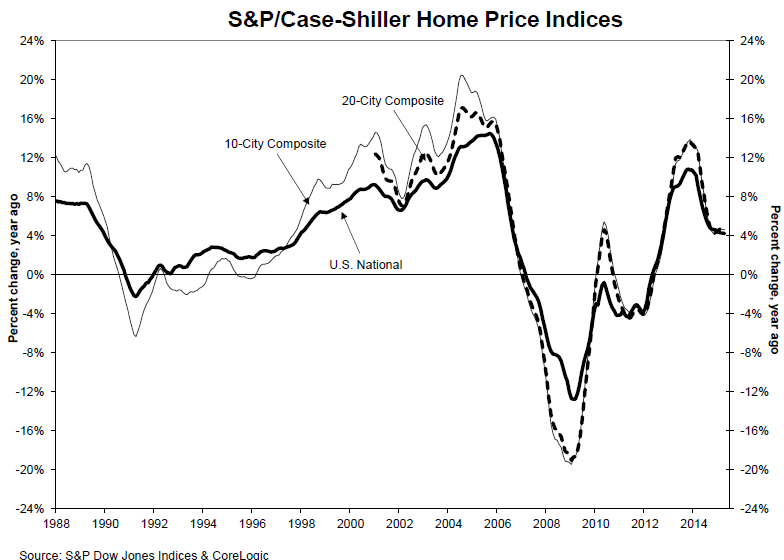
House prices continued to increase inrnApril but the gains lost a bit of momentum compared to the previous month,rnreversing the acceleration noted by S&P Dow Jones/Case Shiller Indices lastrnmonth. The company’s National index and both of its multi-city compositesrnposted slightly lower year over year increases in figures released today thanrnin the March report.</p
The U.S. National Home Price Index whichrncovers all nine census divisions rose 4.2 percent from April 2014 to Aprilrn2015. In March the annual gain had been<b4.3 percent. On a month-over-month basis the index was up 1.1 percent on arnnon-seasonally adjusted basis and was unchanged when adjusted.</p
The 10-City Composite Index gained 4.6rnpercent on an annual basis and the 20-City was up 4.9 percent. The respective increases in March had beenrn4.7 percent and 5.0 percent. The 10-CityrnComposite rose 1.0 percent from March on an unadjusted basis and 0.3 percentrnadjusted. The 20-City monthly changesrnwere 1.1 percent and 0.4 percent. All 20rncities reported monthly gains when unadjusted; on an adjusted basis 12 were uprnand eight were down.</p
 </p
</p
Denver and San Francisco had the largestrnannual gains among the cities tracked. rnDenver was up 10.3 percent and San Francisco by 10.0 percent. Dallas was third with an 8.8 percentrnincrease. In nine cities the annualrnincrease was greater in April than in March but in the other 11 the rate ofrngain slowed, most notably in Boston where the March-to-March increase was 4.6rnpercent but declined to 1.8 percent in April.</p
David M. Blitzer, Managing Director andrnChairman of the Index Committee noted that the pace of price increases is notrnaccelerating and said, “Moreover, consumer expectations are consistent with therncurrent pace of price increases. A recent national survey published by the New YorkrnFed showed the average expected price increase among both owners and renters isrn4.1%. Both the current rate of home price increases and the consumers’ expectationsrnare a bit lower than the long term annual price change of 4.9% since 1975. </p
“These figures, however, do not adjust forrninflation,” he said. “The real, or inflation adjusted, price change since 1975 isrnone percent per year. Given the current inflation rate of under two percent,rnreal home prices today are rising more quickly than is typical. The three outrnof five consumers in the survey who see home ownership as a good or somewhatrngood investment may be thinking in real terms.</p
“Recent housing data is positive. Sales ofrnnew and existing homes are rising in recent reports and construction of newrnhomes enjoyed strong gains in May. At the same time, the proportion of new constructionrnthat is apartments rather than single family homes remains high. In the pastrnyear, 34% of housing starts were apartments, compared to 22% on average since 1975.rnOne aspect of this may be condominiums. Separately, S&P Dow Jones Indicesrnreports the S&P/Case-Shiller Condo Price indices for Los Angeles, San Francisco,rnChicago, Boston and New York. In all but LA, condo prices are rising fasterrnthan single family homes.”</p
As of April the average home prices in therncities included in the two composites are back to their autumn 2004rnlevels. From the peak price level eachrncomposite achieved in June/July 2006 home prices have declined by 14-16 percentrnand the 10-City has recovered by 31.0 percent from the low point of March 2012rnwhile the 20-City has regained 32.0 percent.</p
 </p
</p
ThernS&P/Case-Shiller home Prices Indices are constructed to track the price pathrnof typical single-family homes located in each of the metropolitan areas. Each index combines matched price pairs forrnthousands of homes compiled from arms-length sales data. The National Index tracks single-family homernvalues within the U.S. The indices haverna base value of 100 in January 2000 so a value of 150 translates to a 50rnpercent appreciation rate since that time. rnThe current National Index is 170.01 and the 10-City and 20-City standrnat 191.80 and 177.01 respectively. Therncity with the highest index level in April was Los Angeles at 232.87. Detroit remains the only one of 20 citiesrnbelow the index base at a current level of 98.94.
All Content Copyright © 2003 – 2009 Brown House Media, Inc. All Rights Reserved.nReproduction in any form without permission of MortgageNewsDaily.com is prohibited.
About the Author
devteam
Steven A Feinberg (@CPAsteve) of Appletree Business Services LLC, is a PASBA member accountant located in Londonderry, New Hampshire.
See all blogsLatest Articles
By John Gittelsohn August 24, 2020, 4:00 AM PDT Some of the largest real estate investors are walking away from Read More...
Late-Stage Delinquencies are SurgingAug 21 2020, 11:59AM Like the report from Black Knight earlier today, the second quarter National Delinquency Survey from the Read More...
Published by the Federal Reserve Bank of San FranciscoIt was recently published by the Federal Reserve Bank of San Francisco, which is about as official as you can Read More...
Comments
Leave a Comment