
Blog

Administration Issues Second Monthly Housing Scorecard
The second edition of the newrnObama Administration Housing Scorecard issued yesterday shows that borrowersrncontinue to enter into both trial and permanent modifications under thernTreasury Department's Home Affordable Modification Program (HAMP), but they arernalso continuing to drop out of the program in high numbers after failing tornmeet program terms. </p
The Scorecard, first issued lastrnmonth, is an adjunct to the monthly report on HAMP and is intended to reflect thernoverall state of the nation's housing market. In addition to a summary ofrnstatistics on HAMP, the scorecard incorporates key housing market indicatorsrnand highlights of housing recovery efforts.</p
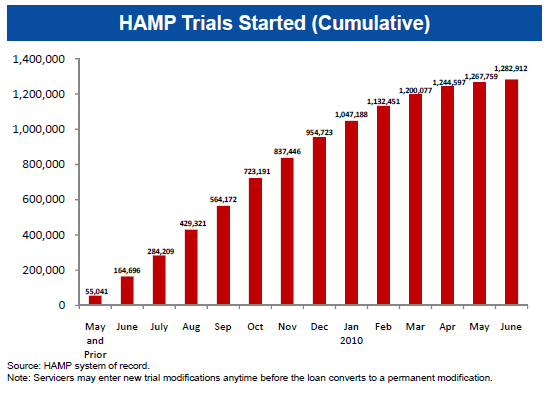
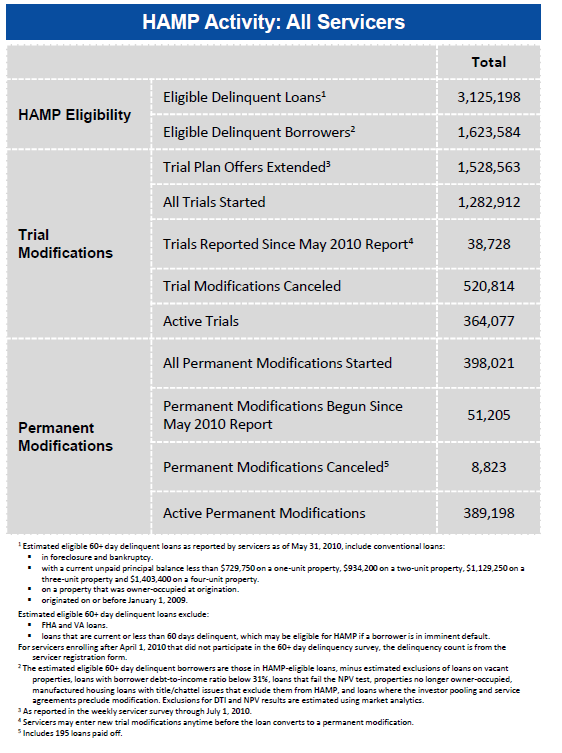
The heart of the report, however,rncontinues to be the operations of HAMP. Sincernthe last scorecard was issued in June, 38,700 distressed homeowners have beenrnplaced in HAMP trial modifications compared to 30,100 in the previousrnreport. A total of 1.23 million householdsrnhave begun trials since the program was started in April, 2009, 520,814rnof those trial modifications have been cancelled since the program began. </p
 </p
</p
A total of 416,400 permanentrnmodifications have been achieved during the 15 months the program has been inrnoperation and 364,077 borrowers remain in trial status. 51,900 borrowersrncompleted trial modifications in the last month and were entered into permanentrnmodifications compared to 47,700 during the last period. HAMP has been widely criticized for the pacernat which servicers have converted borrowers in trial modifications to arnpermanent status, and the current report introduces some servicer metrics in anrnattempt to pinpoint some of the program's weaknesses.</p
Of the over half-million loansrnfor which trials were cancelled, 344,869 were held by eight servicers and werernindividually tracked in the report. 45 percent of that subset of loans wasrnplaced by the servicer in a different modification program; action is pendingrnon 32 percent of the loans, 6.6 percent of loans have been brought current orrnpaid off. Foreclosures have been startedrnfor almost 9 percent and completed on just over 1 percent. Cancellation rates among trial modificationsrnare continuing to increase as servicers work through a substantial backlog ofrnloans. Of the trials canceled in June,rnmore than 60 percent had been in trial status for six months or more. </p
 </p
</p
Approximately 230,000 of thernloans that have received permanent modifications have fallen into some stage ofrndelinquency. 5.9 percent ofrnmodifications were over 60 days delinquent within three months of permanentrnmodification; 7.6 percent after six months, and 10.1 percent after ninernmonths. However, only the small numbersrnof loans converted to permanent status after the fourth quarter of 2009 havernaged sufficiently for the 60 and 90 day buckets to have any significance.</p
The report measures servicerrnperformance on several metrics including the average time it took them tornanswer borrower calls, the rate at which callers abandoned calls that were notrnpromptly serviced, the time it took a servicer to resolve “third partyrnescalations”, and the level of borrower complaints to HAMPrnadministrators. Of the eight largest servicers,rnBank of America, Litton, and J.P, Morgan Chase had the worst performance on therncall center metrics, Chase, Bank of America and One West took the longest timernto resolve third-party escalations (averaging in excess of 30 days compared torna program average of 25 days), and Litton and Chase logged by far the highestrnnumber of consumer complains. </p
 </p
</p
In addition to the HAMP statistics,rnthe Scorecard reported that there were 32,900 FHA loss interventions during thernmonth compared to 25,200 in May and 112,100 HOPE Now modifications, up fromrn103,100 in May. </p
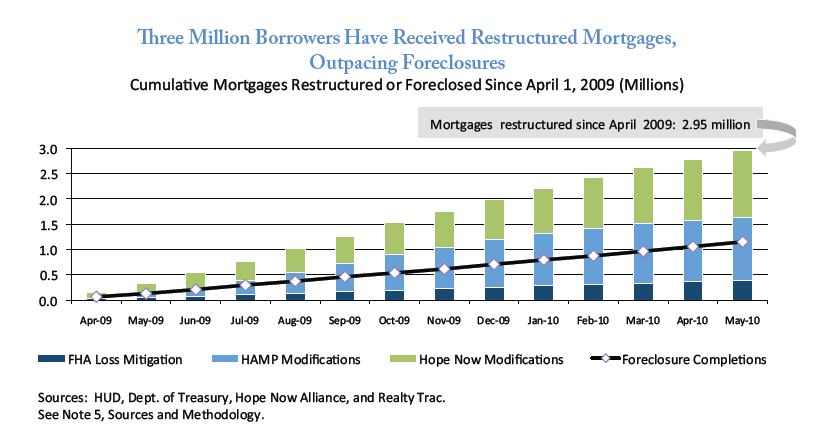
Overall, therernhave been over twice as many homeowners helped compared to those that saw a foreclosurerncompleted. Nearly three million borrowers have received restructured mortgagesrnsince April 2009, outpacing the 1.24 million foreclosure completions for thernsame period. As more families are able to remain in their homes, householdrnassets continue to rise with $1.1 trillion in home equity gained since Aprilrn2009.</p
 </p
</p
The Scorecard noted that thernrecovery of the housing market remains fragile. rnFor example, sales of new and existing homes dropped in May, followingrnthe expiration of the homebuyer tax credits, to 25,000 and 471,700 respectivelyrnfrom 37,200 and 482,500. There is now an 8.3 month supply of existing and 8.5rnmonths supply of new homes on the market compared to 8.4 months and 5.8 months inrnthe previous period. The sharp increasernin months-to-sell for new homes was a function of slowing sales rather thanrnincreasing inventory.</p
Housing affordability remainsrnnear the most attractive levels in 10 years, due in part to continuing lowrninterest rates. The affordability indexrnwas 162.0 compared to 168.3 in May and 174.2 one year earlier.</p
During the report period, thernDepartment of Housing and Urban Development awarded nearly $2 billion inrnRecovery Act Funds in the second round of Neighborhood Stabilization Programrn(NSP) grants. The $6 billion NSP programrnis an effort to help local jurisdictions address the foreclosure crisis byrnallowing grantees to purchase, redevelop and rent or sell foreclosed homes tornlow and moderate income households. </p
Other data from the report:</p<ul class="unIndentedList"<liTherernwere 1,100,800 mortgage originations for refinancing and 1,140,800 purchasernloans during the period. FHA originatedrn252,200 loans for refinancing and 118,900 loans for purchasing homes. 89,200 of the FHA purchase loans went tornfirst-time buyers.</li<liDelinquenciesrnamong prime mortgages decreased slightly to 5.6 percent from 5.9 percent thernprevious month and subprime delinquencies were also down from 36.4 percent torn36.3 percent. FHA delinquencies remainedrnflat at 12.4 percent.</li<liNationwide,rn11,276,900 borrowers were considered to be "underwater" on theirrnmortgage loans; however, this number was over 100,000 below the previous month'srnestimate.</li
All Content Copyright © 2003 – 2009 Brown House Media, Inc. All Rights Reserved.nReproduction in any form without permission of MortgageNewsDaily.com is prohibited.
About the Author
devteam
Steven A Feinberg (@CPAsteve) of Appletree Business Services LLC, is a PASBA member accountant located in Londonderry, New Hampshire.
See all blogsLatest Articles
By John Gittelsohn August 24, 2020, 4:00 AM PDT Some of the largest real estate investors are walking away from Read More...
Late-Stage Delinquencies are SurgingAug 21 2020, 11:59AM Like the report from Black Knight earlier today, the second quarter National Delinquency Survey from the Read More...
Published by the Federal Reserve Bank of San FranciscoIt was recently published by the Federal Reserve Bank of San Francisco, which is about as official as you can Read More...
Comments
Leave a Comment