
Blog

Biggest Drop for Mortgage Delinquencies Since 2002
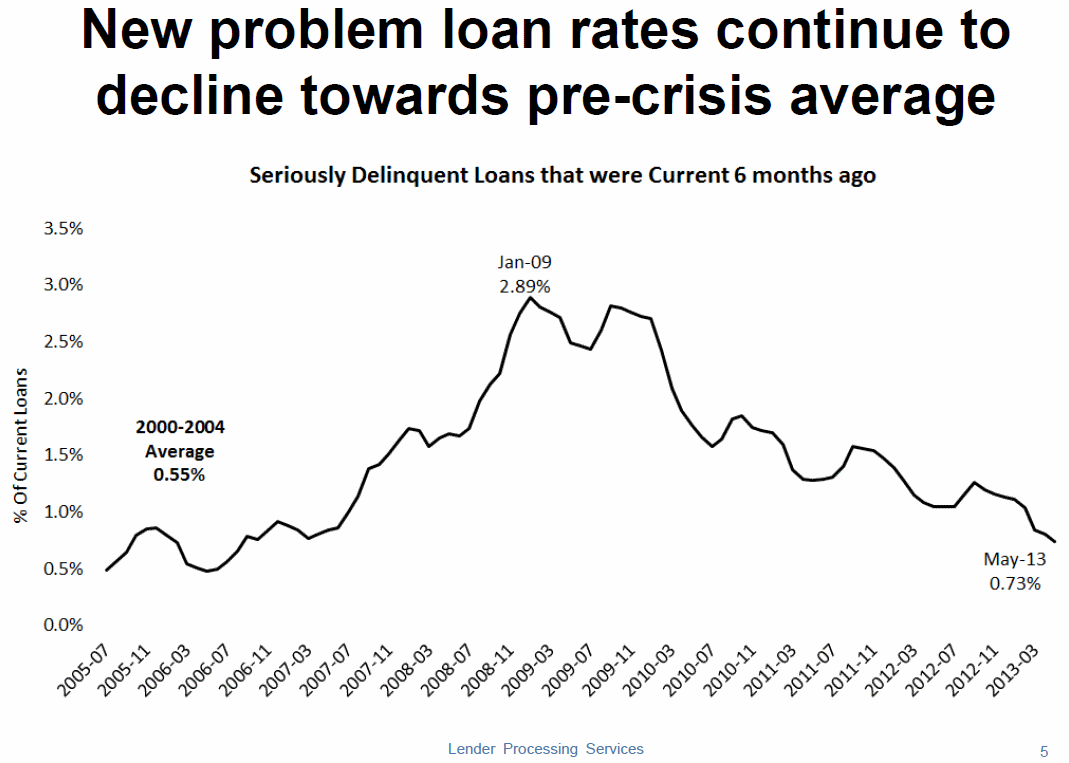
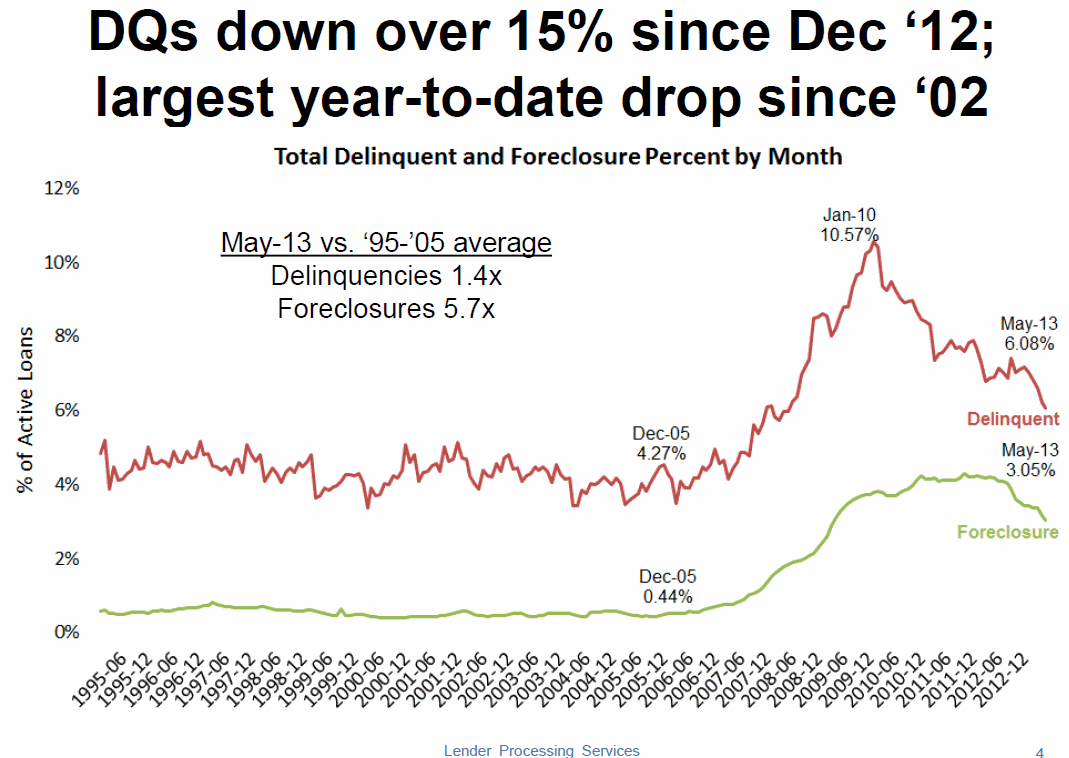
Mortgage delinquencies in May postedrnthe largest year-to-date drop seen since 2002 Lender ProcessingrnServices (LPS) said today. Delinquencies were down 15 percent fromrnthe end of December 2012 to a May rate of 6.08 percent. This was arndrop of 2.11 percent from April. LPS Applied Analytics Senior VicernPresident Herb Blecher said that much of this improvement isrnsupported by the fact that new problem loan rates are approaching thernpre-crisis average. </p
(any chart can be clicked to enlarge)</p
 </p
</p
Blecher said, “Though they are<bstill approximately 1.4 times what they were, on average, during thern1995 to 2005 period, delinquencies have come down significantly fromrntheir January 2010 peak. In large part, this is due to therncontinuing decline in new problem loans — as fewer problem loans arerncoming into the system, the existing inventories are working theirrnway through the pipeline. New problem loan rates are now at just 0.73rnpercent, which is right about on par with the annual averages duringrn2005 and 2006, and extremely close to the 0.55 percent average forrnthe 2000-2004 period preceding.”</p
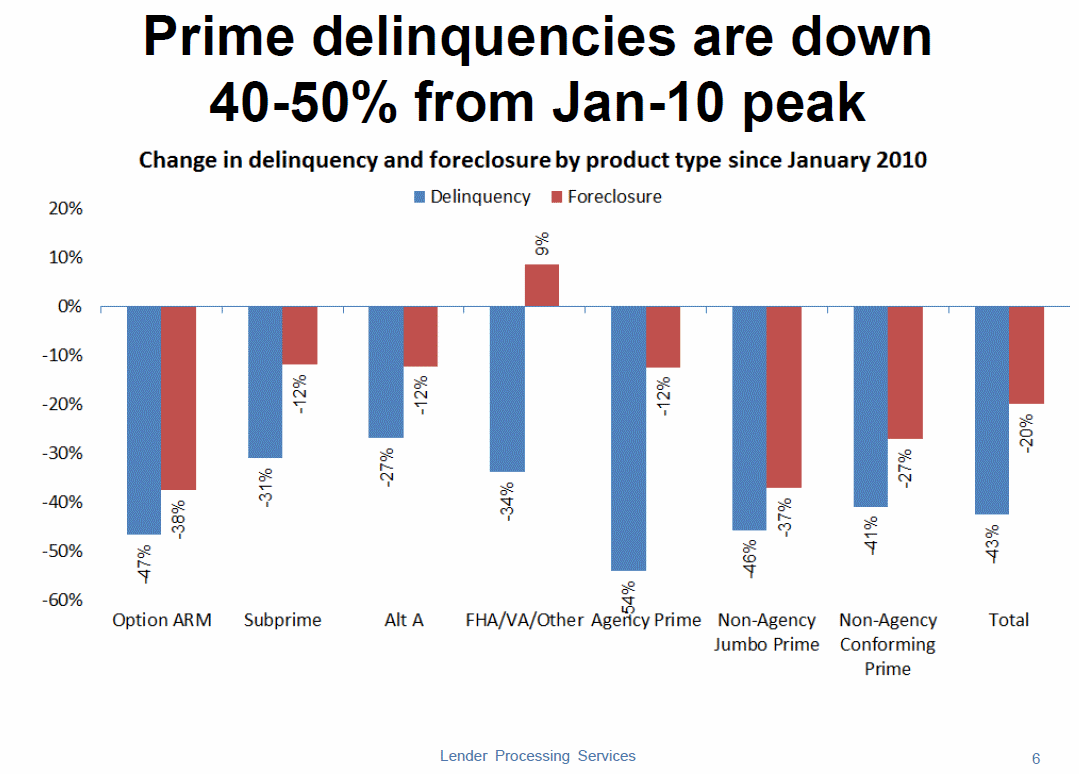
The LPS Mortgage Monitor</ifor May noted that the current delinquency rate is more than 4rnpercentage points below the peak of the mortgage crisis in Januaryrn2010 and delinquencies of prime mortgages are down nearly 50 percentrnfrom that point in time. The total pre-sale inventory rate (homes inrnsome stage of foreclosure) also continued to decline, down 3.91rnpercent from April to 3.05 percent. There were 116,812 foreclosurernstarts during the month compared to 127,496 in April and the lowestrnnumber in at least the last 12 months.</p
 </prn
</prn
 </p
</p
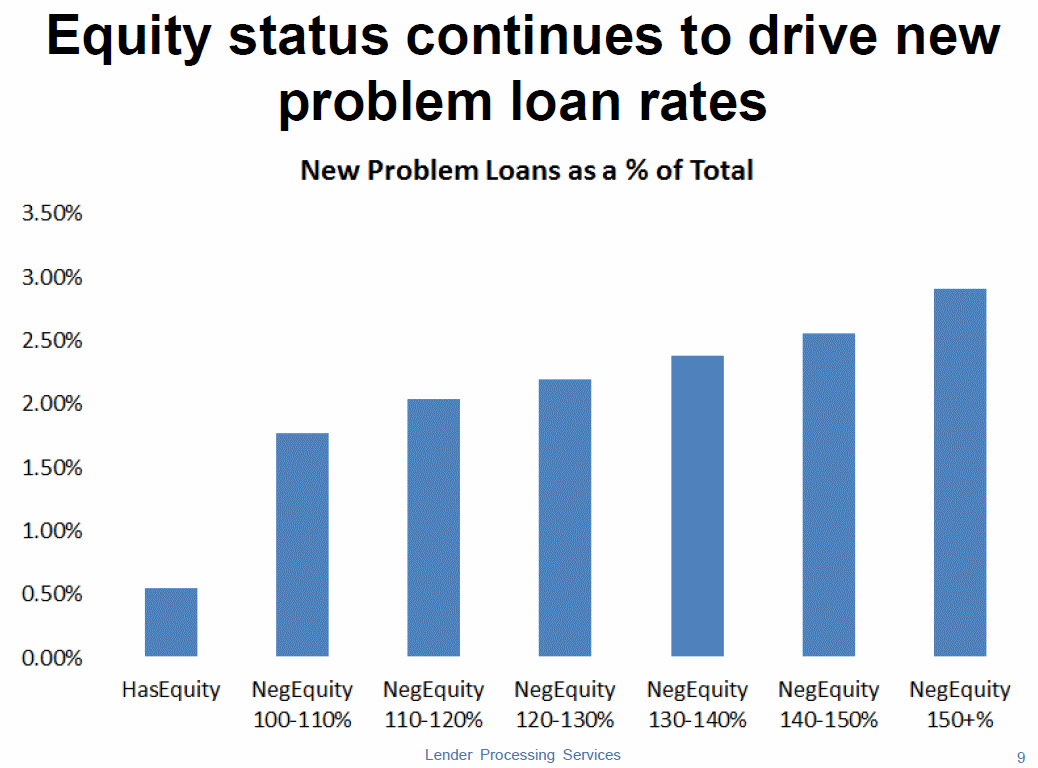
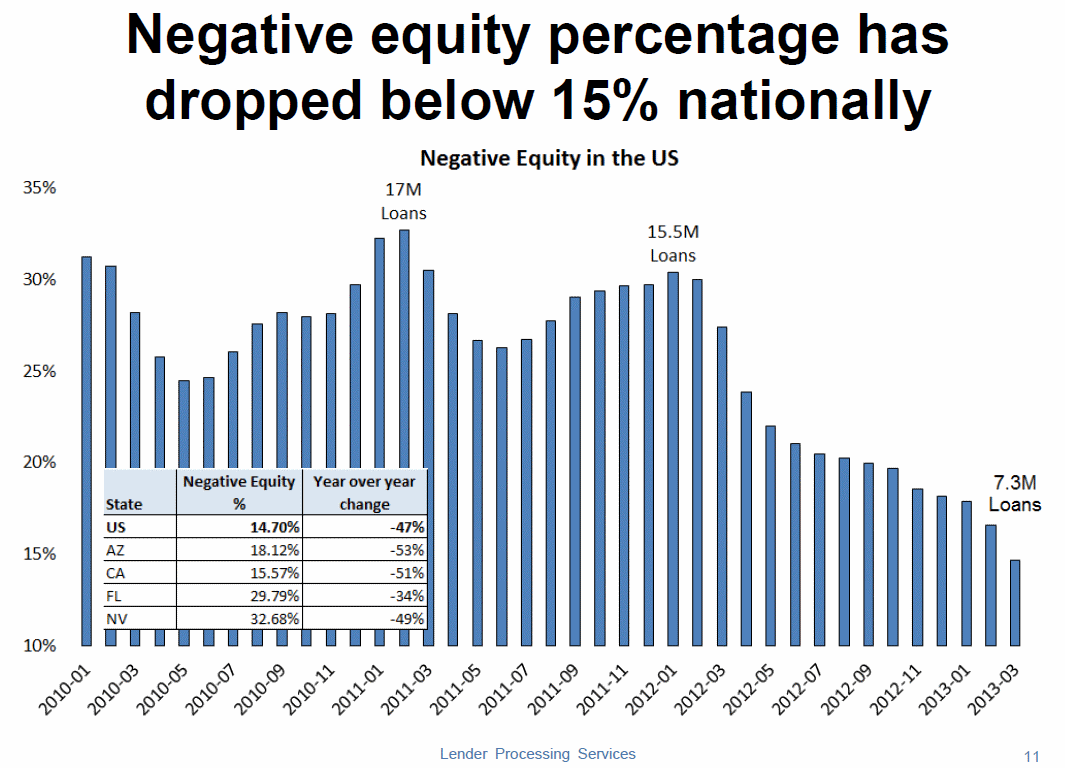
“As we’ve noted before,”rnBlecher continued, “negative equity appears to still be one ofrnthe strongest drivers of new problem loans, and — primarily buoyedrnby home price increases nationwide — that situation also continuesrnto improve. We looked once again at the number of ‘underwater’ loansrnin the U.S., and found that the total share of mortgages with LTVs ofrngreater than 100 percent had declined to just 7.3 million loans as ofrnthe end of the first quarter of 2013. This accounts for less than 15rnpercent of all currently active loans and represents a nearly 50rnpercent year-over-year decline.”</p
 </p
</p
 </p
</p
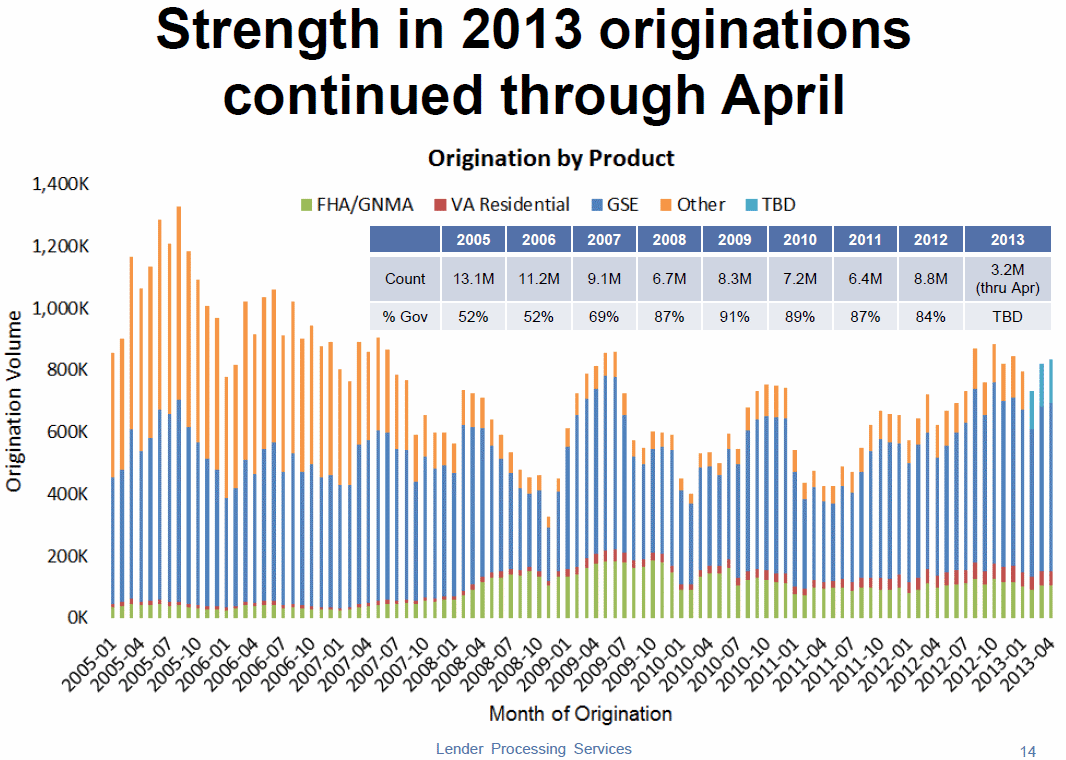
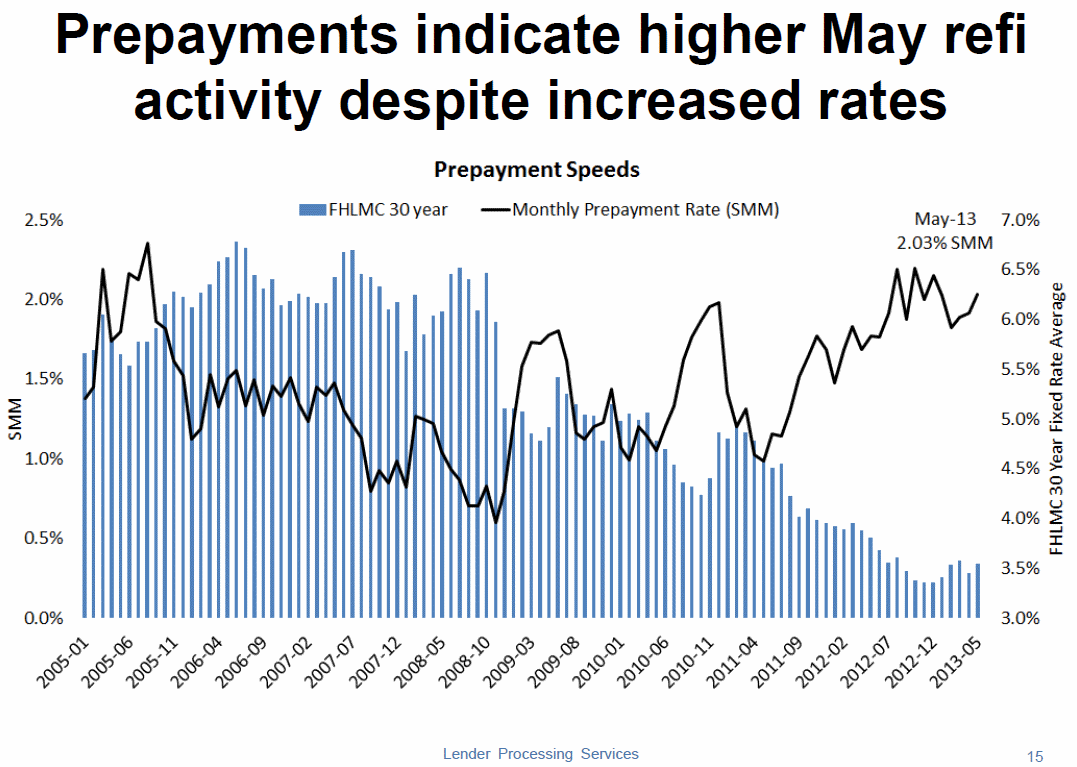
Origination data, provided by LPSrnthrough April, did not yet reflect the recent rate volatility butrnshowed that originations remained strong through that month. Therernwere 835,000 new loans, a 1.8 percent increase from March and 34.1rnpercent growth from April 2012. The May data also showed an increasernin prepayment rates, indicating that refinance activity and likelyrnassociated originations remained strong despite that month’srnincreased interest rates. LPS said it will continue to monitor therndata to see what impact rate increases may have on originations inrnthe months to come.</p
 </p
</p
All Content Copyright © 2003 – 2009 Brown House Media, Inc. All Rights Reserved.nReproduction in any form without permission of MortgageNewsDaily.com is prohibited.
About the Author
devteam
Steven A Feinberg (@CPAsteve) of Appletree Business Services LLC, is a PASBA member accountant located in Londonderry, New Hampshire.
See all blogsLatest Articles
By John Gittelsohn August 24, 2020, 4:00 AM PDT Some of the largest real estate investors are walking away from Read More...
Late-Stage Delinquencies are SurgingAug 21 2020, 11:59AM Like the report from Black Knight earlier today, the second quarter National Delinquency Survey from the Read More...
Published by the Federal Reserve Bank of San FranciscoIt was recently published by the Federal Reserve Bank of San Francisco, which is about as official as you can Read More...
Comments
Leave a Comment