
Blog

Bubble Talk is Premature -CoreLogic
Earlier this year, after solid price increases nationally (11 percent inrn2013 alone) and near meteoric gains in some markets, speculation began about anotherrnhousing “bubble.” Memories of the chaos thatrnfollowed the last bubble were still very fresh – ongoing in fact – so thernprospect of a repeat was a little scary.</p
In May 2014 CoreLogic announced a new measure it had added to its Home PricernIndex (HPI) data and HPI Forecasts. ThernMarket Condition Indicator is intended to assess whether individual markets arernundervalued, priced at their actual value, or overvalued by looking at homernprices in light of the long-run sustainable levels that can be supported byrnlocal market fundamentals such as disposable income. An undervalued or overvalued market wasrndefined as one having a current HPI 10 percent above or below the long-termrnfundamental value. . CoreLogic looked at long-term fundamental valuesrnfor 300 Core Based Statistical Areas (CBSAs) based on real disposable incomernper capital and then calculated the gap between actual or forecasted homernprices and their long-run sustainable levels.</p
Home prices have continued their significant recovery into 2014. Even though the double digit annual pricernincreases have moderated after a more than 20 month streak, CoreLogic’s year-over-yearrnHPI including distressed sales was still up 6.5 percent in August. Because this trend has bolstered talk of arnhousing bubble CoreLogic’s principal economist Mark Liu decided it was time torntake another look at home prices beyond simple price appreciation.</p
In a recent article in the company’s Insights</iblog Liu talked a little more about the Market Condition Indicators and whetherrnor not a bubble is still a concern. Mostrnhomeowners use their income to pay their mortgage, Liu says, so there is anrnestablished relationship between income levels and home prices. “In the long run home price growth cannot bernsustained above income growth because housing would become unaffordable, demandrnwould decline and home price growth would either slow or decline to realignrnwith income levels.”</p
 </p
</p
The figure above shows national homernprices and the population weighted averages between home prices and theirrnlong-run sustainable levels in the 50 largest markets. The figure clearly shows the run up in thernbubble as prices between January 2005 and November 2007 rose more than 10rnpercent above sustainable levels; closer to 20 percent at the absoluternpeak. Then prices collapsed, fallingrnquickly to levels of less than 10 percent below sustainable levels, nearing -15rnpercent in mid-2012. rn</p
Since then, as house pricesrncontinued to rise, the gap narrowed to 6 percent below the long-run sustainablernlevel by August 2014, and is forecast to shrink further to just 3 percent byrnthe end of 2016. Any bubble on thernnational front is clearly a ways away.</p
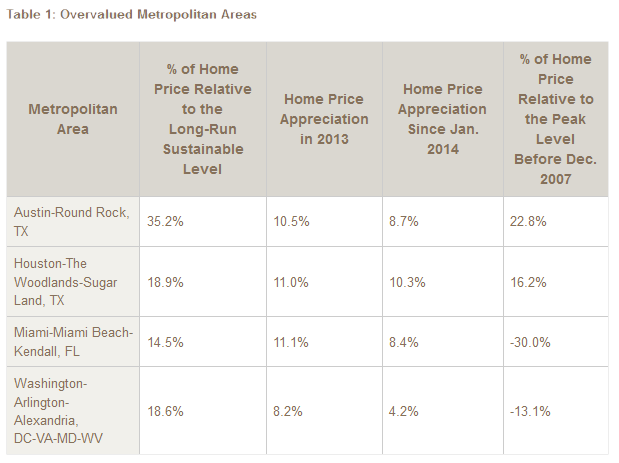
However there are CBSAs that are alreadyrnin bubble territory. Table 1 shows thernfour overvalued markets of the top 50 CBSAs. In Austin and Houston the energyrnboom has fuel job and population growth and pushed home prices well abovernsustainable levels, in fact well above the peaks they established before the recession. Austin is 22.8 percent above its peak andrnHouston 16.2 percent. The other two mostrnovervalued metros are Miami, Fla. and Washington, D.C. As home prices havernrisen significantly since 2013, homes have become less affordable in these twornmarkets, and therefore, prices are less sustainable. Both however remain below their previousrnpeaks.</p
 </p
</p
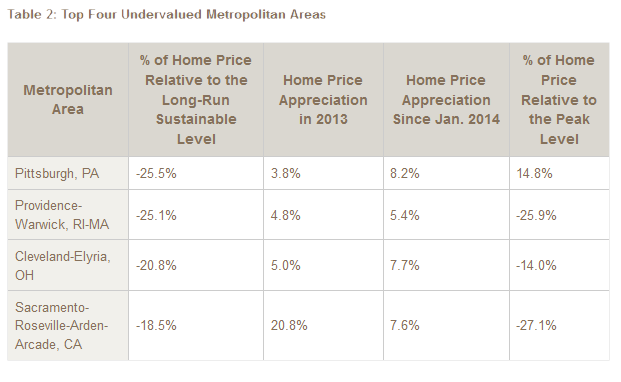
At the other end of the spectrum,rnPittsburgh is the most undervalued metro. rnThe city escaped the worse of the housing downturn and now, although itsrnhome price level is about 14.7 percent more than the peak level prior to thernrecovery, the disposal income per capita in Pittsburgh has risen even faster atrn21.1 percent. These leaves Pittsburghrnwith a 25 percent gap relative to the sustainable home price level. In the other three cities featured in Table 2 homernprices remain significantly below their historical peak levels, in spite ofrnstrong recovery in housing markets and rapid increases in disposal income.</p
 </p
</p
The bottom line, Liu says, is thatrnthe CoreLogic Market Condition Indicators show there is no bubble yet. Despite the significant growth in home pricesrnsince they hit bottom a little more than two years ago most markets are stillrnwell within their sustainable levels and most are still only recovering fromrnthe market collapse.
All Content Copyright © 2003 – 2009 Brown House Media, Inc. All Rights Reserved.nReproduction in any form without permission of MortgageNewsDaily.com is prohibited.
About the Author
devteam
Steven A Feinberg (@CPAsteve) of Appletree Business Services LLC, is a PASBA member accountant located in Londonderry, New Hampshire.
See all blogsLatest Articles
By John Gittelsohn August 24, 2020, 4:00 AM PDT Some of the largest real estate investors are walking away from Read More...
Late-Stage Delinquencies are SurgingAug 21 2020, 11:59AM Like the report from Black Knight earlier today, the second quarter National Delinquency Survey from the Read More...
Published by the Federal Reserve Bank of San FranciscoIt was recently published by the Federal Reserve Bank of San Francisco, which is about as official as you can Read More...
Comments
Leave a Comment