
Blog

California Pending Sales Falling at Fastest Pace in More than 12 Months
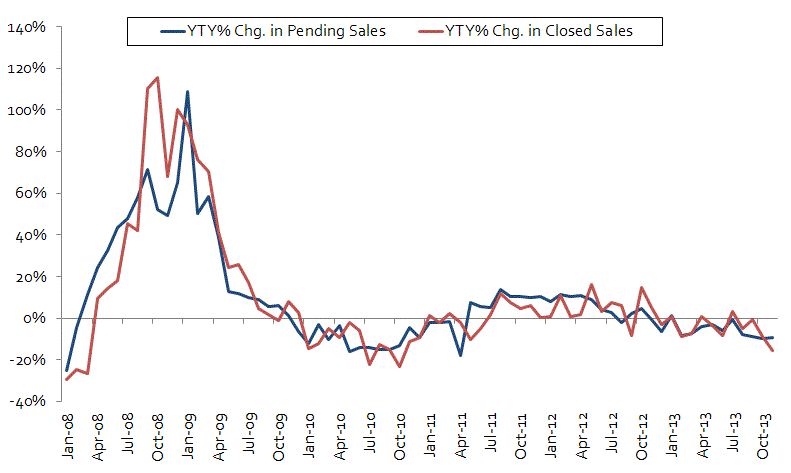
Pending home sales in California experiencedrnthe first double digit drop in over a year in November, falling 13.6 percentrnfrom October to a Pending Home Sale Index level of 93.8. The Index, based on signed contracts for homernpurchases, was down 9.4 percent from the 103.5 level of November 2012. The California Association of Realtors®rn(C.A.R.) blamed the November decline partially on seasonal factors but notedrnthat shrinking home affordability also played a role.</p
The Pending Home Sale Index is a leadingrnindicators of closed sales, which typically follow within 60 days.</p
 </p
</p
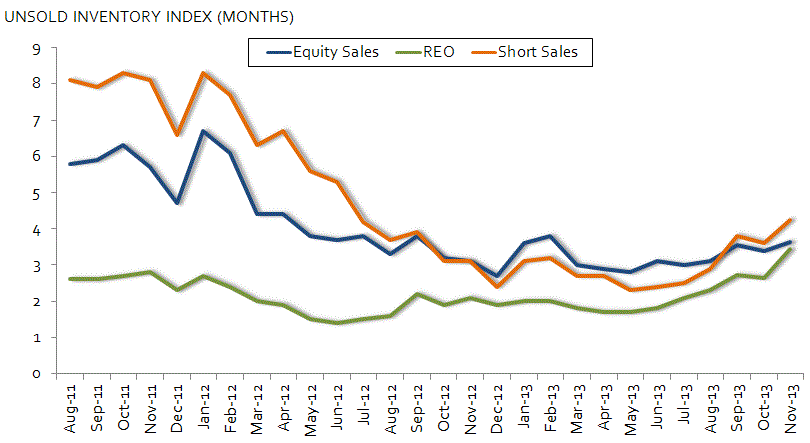
C.A.R. also reported that equity orrnnon-distressed property sales increased their market share in November to 86.4rnpercent. It was the fifth straight monthrnthat equity sales surpassed 80 percent of all sales; they were at an 85.4rnpercent level in October. In Novemberrn2012 equity sales made up only 64.6 percent of the market. </p
Shortrnsales accounted for 8.8 percent of November sales, down from 9.5 percent inrnOctober and 23.3 percent a year earlier. rnSales of foreclosed property (REO) had a 4.4 percent share compared torn4.7 percent in October and was the fourth straight month that REO salesrnconstituted less than 5 percent of all sales. rnOne year earlier 11.8 percent of sales were REO. Twenty-one of the 38 counties respondingrnto C.A.R.’s survey showed a month-over-month decrease in distressed sales with Santa Clara County having the lowest share at 4 percent.</p
Housing inventory levels improvedrnslightly for the second consecutive month but were still extremely low. rnThe Unsold Inventory Index for equity sales inched up from 3.4 months inrnOctober to 3.6 months in November. The supply of REOs rose from 2.7rnmonths in October to 3.4 months in November, and the supply of short salesrnincreased from 3.6 months in October to 4.2 months in November.</p
 </p
</p
C.A.R.’s pending sales informationrnis generated from a survey of more than 70 associations of Realtors andrnMultiple Listing Services throughout the state. The year 2008 was used asrnthe benchmark for the Pending Homes Sales Index. An index of 100 is equalrnto the average level of contract activity during 2008.
All Content Copyright © 2003 – 2009 Brown House Media, Inc. All Rights Reserved.nReproduction in any form without permission of MortgageNewsDaily.com is prohibited.
About the Author
devteam
Steven A Feinberg (@CPAsteve) of Appletree Business Services LLC, is a PASBA member accountant located in Londonderry, New Hampshire.
See all blogsLatest Articles
By John Gittelsohn August 24, 2020, 4:00 AM PDT Some of the largest real estate investors are walking away from Read More...
Late-Stage Delinquencies are SurgingAug 21 2020, 11:59AM Like the report from Black Knight earlier today, the second quarter National Delinquency Survey from the Read More...
Published by the Federal Reserve Bank of San FranciscoIt was recently published by the Federal Reserve Bank of San Francisco, which is about as official as you can Read More...
Comments
Leave a Comment