Blog

California Realtors Confirm Sales Downturn, but Silver Lining is 'Attached'
Monthly sales figures from the CaliforniarnAssociation of Realtors® (C.A.R.) confirm indications from DataQuick datarnposted earlier today that the real estate market in American’s most populousrnstate have slowed. C.A.R. data howeverrnshows continued growth in ‘Attached‘ (condo and townhome) home sales with the slippage limited tornsingle-family homes. </p
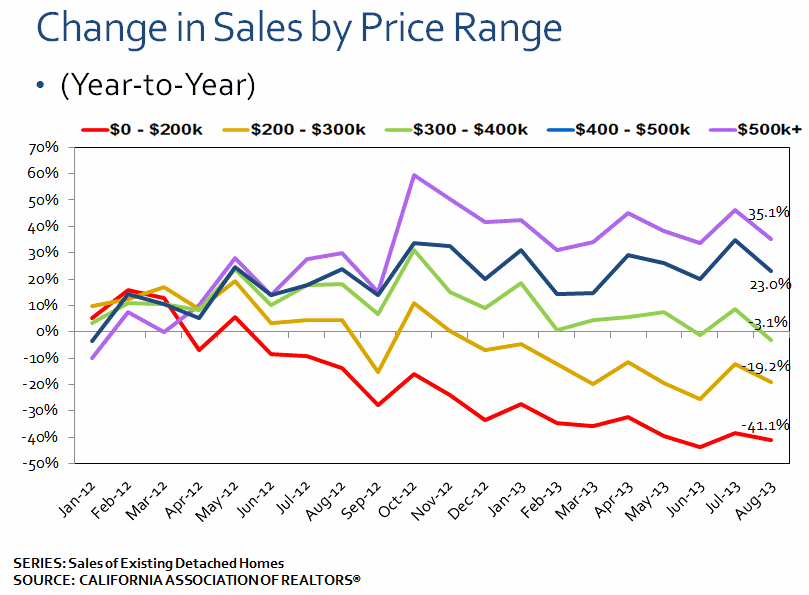
C.A.R. reports that sales ofrnsingle-family detached homes in the state were at a seasonally adjusted annualrnrate of 434,700 units in August. Thisrnwas a decline of 2 percent from a revised 443,500 pace in July and 1.9 percentrnbelow the 443,030 reported in August 2012. rn Sales of condos and townhouses inrncontrast were 8 percent above the rate of sales in August 2012 and are fivernpercent higher for the year to date than they were at the same time lastrnyear. The decline in sales occurred acrossrnall price ranges but was slightly sharper at the upper ranges.</p
 </p
</p
DataQuick numbers are not easilyrncompared to those of C.A.R as the former reports actual monthly sales numbersrnrather than an annualized rate and does not break out sales by propertyrntype. DataQuick reported a month-over-monthrndecrease in sales of 1.9 percent and an annual increase of 3.1 percent. </p
While DataQuick shows a slight dip inrnhome prices from July C.A.R. reports a continuing upward trend. C.A.R. says the median price in August wasrn$441,330 compared to $433,910 in July, an increase of 1.7 percent and thernhighest price recorded since December 2007. rnThis represents an increase of 28.4 percent from the median price in August,rn2012, the 18th month of annual prices increases and the 14th</supstraight month those increases have been in double digits. By contrast DataQuick put the median price atrn$361,000, down 0.6 percent from July and 28.5 percent higher than a yearrnearlier. </p
The available supply of existing,rnsingle-family detached homes increased from 2.9 months in July to 3.1 months,rnabout the same as a year earlier. A six-rnto- seven-month supply is considered typical in a normal market. It took a median of 28.8 days to sell a homernin August compared to 27.8 days in July. rnMedian marketing time in August 2012 was 41.1 days.</p
“Housing inventory levels are improving,rnespecially in homes priced below $750,000. Indeed, the number of activernlistings across all price ranges has been rising on a month-to-month basis forrnthe last six months and has reached the highest level since mid-2012,” saidrnC.A.R. Vice President and Chief Economist Leslie Appleton-Young. “Asrnhousing supply loosens up with the seasonal slowdown, annual home pricernincreases are expected to taper as we’ve observed in the last two months.”
All Content Copyright © 2003 – 2009 Brown House Media, Inc. All Rights Reserved.nReproduction in any form without permission of MortgageNewsDaily.com is prohibited.
Latest Articles
By John Gittelsohn August 24, 2020, 4:00 AM PDT Some of the largest real estate investors are walking away from Read More...
Late-Stage Delinquencies are SurgingAug 21 2020, 11:59AM Like the report from Black Knight earlier today, the second quarter National Delinquency Survey from the Read More...
Published by the Federal Reserve Bank of San FranciscoIt was recently published by the Federal Reserve Bank of San Francisco, which is about as official as you can Read More...

Comments
Leave a Comment