Blog

Case-Shiller, FHFA Agree House Appreciation Slowing
Depending on which report you read this morning – that from Case-Shiller or from the Federal Housing Finance Agency (FHFA), home prices inrnApril were either flattening or out and out flat. S&P’s Case-Shiller Home Price Indicesrn(HPI) were up by about 1 percent nationally but many cities reported lowerrnreturns monthly than in March and nearly all had annual increases lower than inrnthe previous report. The FHFI HPI showedrnno increase whatsoever from March when the HPI increased by 0.7 percent.</p
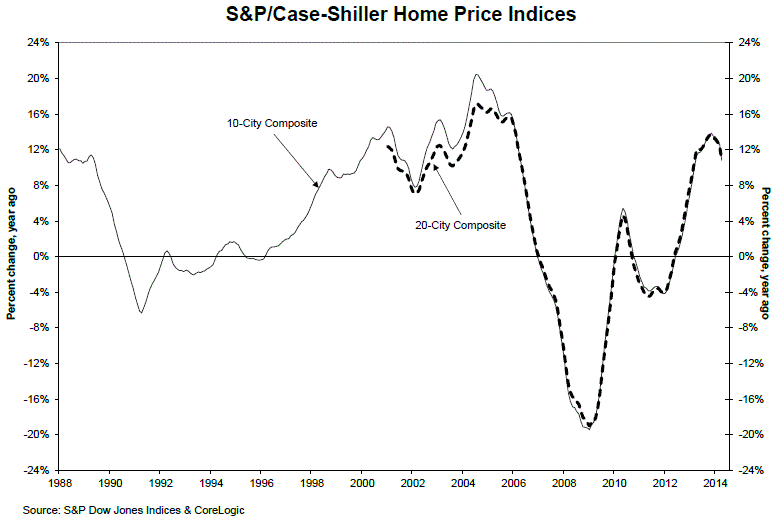
Case-Shiller’s 10-City and 20-City Composites rose 1.0 and 1.1rnrespectively from March to April and posted annual gains of 10.8 percent. Annual gains for the two indices in March werernin excess of 12 percent. Nineteen of thern20 cities also posted lower annual gains in April than in the previous monthrnand three former high-flying cities, Los Angeles, San Diego, and San Francisco,rnsaw annual returns worsen by approximately three percentage points. San Francisco’s 18.2 percent annual gainrnmarked the first time in 14 months this statistic fell below 20 percent. The city however did pull out a monthly gain ofrn2.3 percent. </p
All 20 cities had higher HPI’s in April than in March but seven,rnCleveland, Los Angeles, Miami, Phoenix San Diego, and San Francisco had smallerrngains than in the previous month. Boston’srnHPI was up 2.9 percent from March, the largest monthly gain in 27 years. It was also the only city to improve on itsrnMarch annual number, a 12 month gain that went from 8.3 percent to 9.0rnpercent.</p
 </p
</p
“Although home prices rose in April, the annual gains weakened,” says David M. Blitzer,rnChairman of the Index Committeernat S&P Dow Jones Indices.rn”Overall, prices are rising month-to-month but at a slower rate. Last year some Sunbelt cities were seeing year-over-year numbers close to 30rnpercent, now all are below 20rnpercent: Las Vegas (18.8 percent), Los Angeles (14.0rnpercent), Phoenixrn(9.8 percent), San Diego (15.3rnpercent) and San Francisco (18.2rnpercent). Other cities around the nation are also experiencing slower price </p
“While the annual numbers worsened, the monthly figures were seasonally strong. Five cities – Atlanta,rnBoston, Chicago, San Francisco and Seattlern- reported monthlyrngains of 2 percent or more. Dallasrnand Denver gained 1.6 percent and continue to set new peaks. Boston and Charlotternare less than 10rnpercent away from their peaks.</p
“Near term economic factors favor further gains in housing: mortgage rates are lower than a year ago, the Fed is expectedrnto keep interestrnrates steady until mid-2015 and the labor market is improving. However,rnhousing is not back to normal: pricesrnare being supported by cash sales,rnlow inventories and decliningrnforeclosure and REO sales. First timernhome buyers are not back in force and qualifying for a mortgage remains challenging. The questionrnis whether housingrnwill bounce back before the Fed begins torntighten sometime next year.”</p
 </p
</p
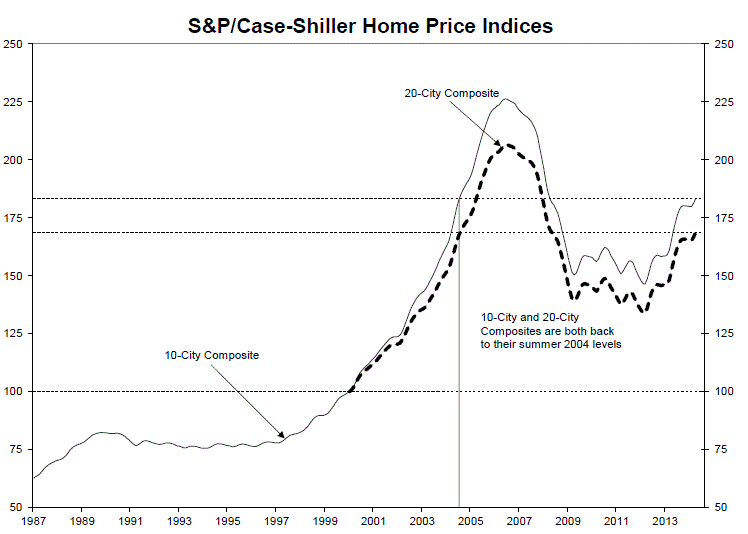
Average home prices in April were back to their summer 2004 levels. Measured from their June/Julyrn2006 peaks, the peak-to-current decline for both Composites is approximately 18-19rnpercent. The recoveryrnfrom the Marchrn2012 lows is 25-26 percent for the 10-City and 20-City Composites.</p
In addition to Boston and San Francisco, ten cities sawrnhigher monthly returns than in March with Seattle matching San Francisco’s 2.3rnpercent jump. At the bottom of the list New York gained onlyrn0.1 percent but that was an improvement on March’s -0.4 percent. Detroit remains the only city below its January 2000 value.</p
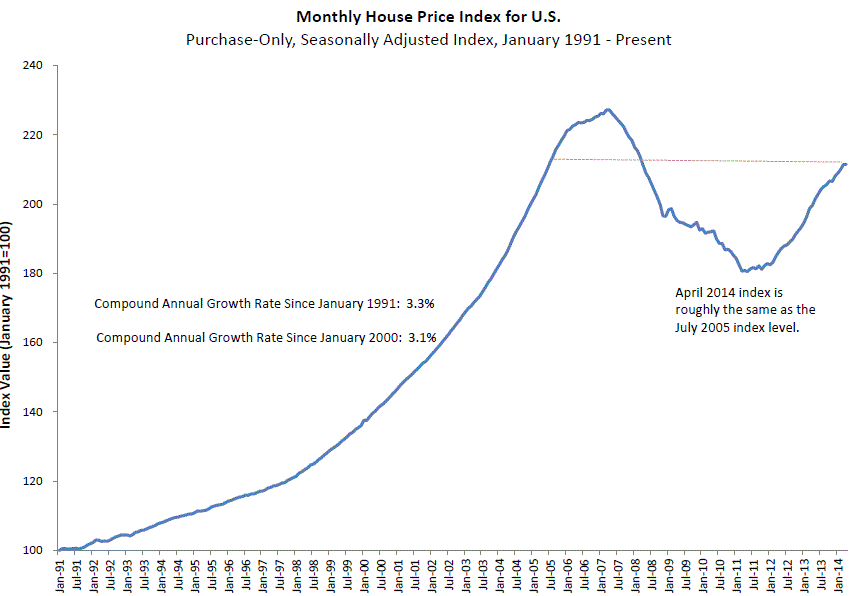
FHFA said its April HPI which was unchanged from Marchrnrepresented an annual increase of 5.9 percent. rnThe annual increase as of April 2013 was 7.2 percent. The U.S. index is 6.9 percent below its peakrnin April 2007 and at about the same level as in July 2005. </p
 </p
</p
The monthly changes ranged from a low of -1.3 percent inrnNew England to +0.6 percent in the East South Central division. Annual changes were all positive, rangingrnfrom a low of 1.7 percent in the Middle Atlantic division to 10.7 percent inrnthe Pacific division.</p
The S&P/Case-Shiller Home PricernIndices are constructed to track the price path of typical single-family homes located in each metropolitan area provided. Each index combinesrnmatched price pairs for thousandsrnof individual houses from the available universe of arms-length sales data. The indicesrnhave a base value of 100 in Januaryrn2000; thus, for example, a current index value of 150 translates to a 50rnpercent appreciation rate since January 2000 for a typicalrnhome located within the subject market.rn</p
The FHFA HPI is a weighted,rnrepeat-sales index obtained by reviewing repeat mortgage transactions on single-familyrnproperties whose mortgages have been purchased or securitized by Fannie Mae orrnFreddie Mac since January 1975.
All Content Copyright © 2003 – 2009 Brown House Media, Inc. All Rights Reserved.nReproduction in any form without permission of MortgageNewsDaily.com is prohibited.
Latest Articles
By John Gittelsohn August 24, 2020, 4:00 AM PDT Some of the largest real estate investors are walking away from Read More...
Late-Stage Delinquencies are SurgingAug 21 2020, 11:59AM Like the report from Black Knight earlier today, the second quarter National Delinquency Survey from the Read More...
Published by the Federal Reserve Bank of San FranciscoIt was recently published by the Federal Reserve Bank of San Francisco, which is about as official as you can Read More...

Comments
Leave a Comment