
Blog

Case-Shiller Home Price Data Yet to Reflect Increase in Buyer Demand
Standard and Poors released February S&P/Case-Shiller Home Price Indices this morning.
The S&P/Case-Shiller Home Price Indices are constructed to accurately track the price path of typical single-family homes located in each metropolitan area provided. Each index combines matched price pairs for thousands of individual houses from the available universe of arms-length sales data. The indices have a base value of 100 in January 2000; thus, for example, a current index value of 150 translates to a 50% appreciation rate since January 2000 for a typical home located within the subject market.
Before discussing the data, it is important to point out that S&P released a note offering some guidance on digesting their home price indices. Here is a portion of the statement:

Economic data which are affected by the time of the year, or the seasons, are often adjusted to remove these effects to make it easier to identify underlying changes in the economy. Seasonal adjustment increases the unadjusted values in weak months and decreases the unadjusted values in strong months to eliminate regular seasonal patterns while leaving the underlying trend unaffected.
For the S&P/Case-Shiller Home Price Indices, S&P reports two data sets – before seasonal adjustment and seasonally-adjusted. In some recent reports the two series have given conflicting signals, with the seasonally-adjusted series rising month-over-month and the unadjusted series declining.
After reviewing the data, the S&P/Case-Shiller Home Price Index Committee believes that, for the present, the unadjusted series is a more reliable indicator and, thus, reports should focus on the year-over-year changes where seasonal shifts are not a factor. Additionally, if monthly changes are considered, the unadjusted series should be used.
This note explains the committee’s reasons.
———————————————————————–
If you've been following the S&P/Case-Shiller index on MortgageNews Daily, we've been communicating the data on a non-seasonallyadjusted basis all along….so your perspective doesn't need any adjusting!
With that in mind…
On a non-seasonallyadjusted basis, in February, the 20-city home price index fell 0.9 percent to144.03 while the10-city home price index declined 0.6 percent to 156.8.
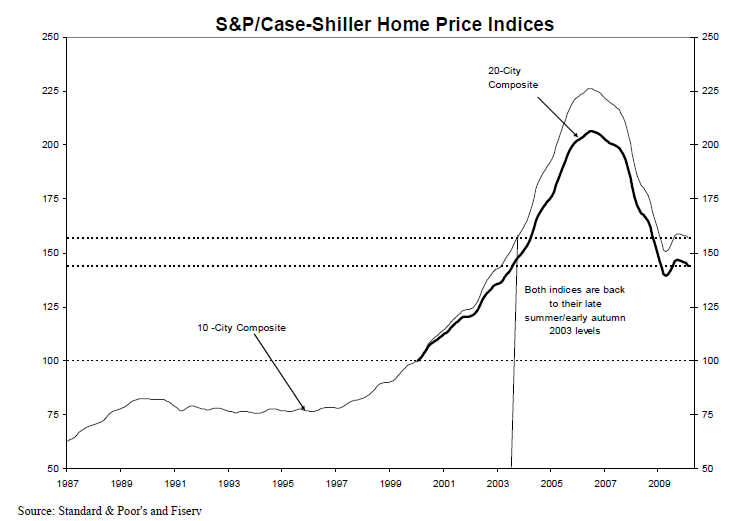
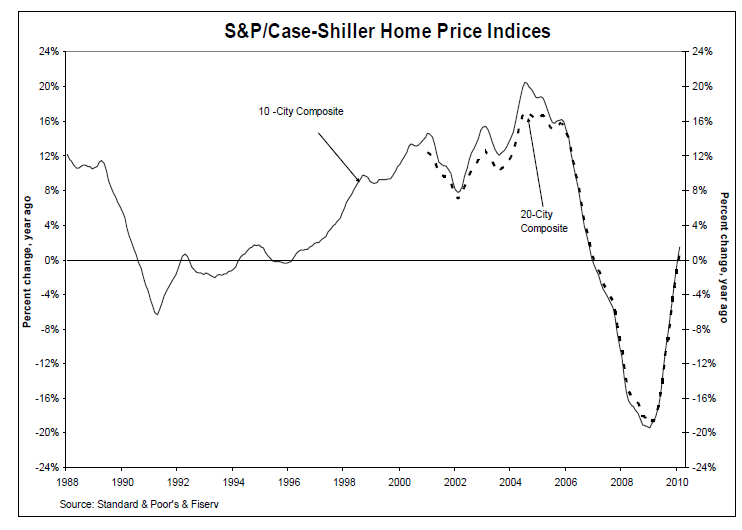
On a year over year basis, the 10 city index is now up 1.4 percent from last February and the 20 city index is up 0.6 percent. This is the first time since Devember 2006 that both annual rates of change for the two composites have been positive.
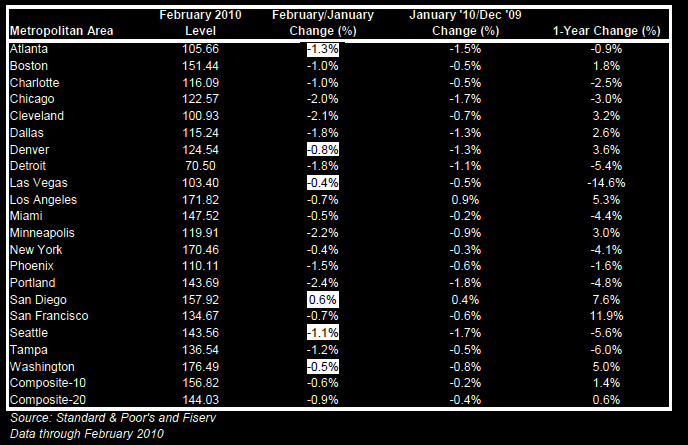
Below is a city by city breakdown.
- 6 of 20 cities saw less month over month contraction in February vs. January.
- Only 1 out of 20 cities, San Diego, showed month over month improvement, all others experienced further home price declines from January 2010 with 12 of 20 falling by at least 1.0 percent.
- Charlotte, Las Vegas, New York, Portland, Seattle and Tampa all posted new index lows.
- Charlotte and Cleveland have shown seven consecutive months of negative monthly returns. Atlanta, Boston, Denver, New York and Tampa have declined for six consecutive months.
David M.Blitzer, Chairman of the Index Committee at Standard & Poor’s says:
“These data point to a risk that home prices could decline further before experiencing any sustained gains. While the year-over-year data continued to improve for 18 of the 20 MSAs and the two Composites, this simply confirms that the pace of decline is less severe than a year ago. It is too early to say that the housing market is recovering”
While this release seems scary, I must remind that this report covers FEBRUARY and existing home sales and new home sales were first seen rising in MARCH. So any good news one might have seen in recent housing data has yet to be factored into home prices.
Unfortunately, because the majority of sales are distressed properties or in a neighborhood affected by distressed sales, home prices may find it difficult to do much besides stabilize in the months ahead.
Blitzer confirms that theory…
“Existing and new home sales, inventories and housing starts all show tremendous improvement in their March statistics. The homebuyer tax credit, available until the end of April, is the likely cause for these encouraging numbers and this may also flow through to some of our home price data in the next few months. Amidst all the news, however, we should also pay heed to foreclosure activity, which have reached their highest level in at least the last five years. As these homes are put up for sales, we may see some further dampening in home prices.”rn
All Content Copyright © 2003 – 2009 Brown House Media, Inc. All Rights Reserved.nReproduction in any form without permission of MortgageNewsDaily.com is prohibited.
About the Author
devteam
Steven A Feinberg (@CPAsteve) of Appletree Business Services LLC, is a PASBA member accountant located in Londonderry, New Hampshire.
See all blogsLatest Articles
By John Gittelsohn August 24, 2020, 4:00 AM PDT Some of the largest real estate investors are walking away from Read More...
Late-Stage Delinquencies are SurgingAug 21 2020, 11:59AM Like the report from Black Knight earlier today, the second quarter National Delinquency Survey from the Read More...
Published by the Federal Reserve Bank of San FranciscoIt was recently published by the Federal Reserve Bank of San Francisco, which is about as official as you can Read More...
Comments
Leave a Comment