
Blog

Case-Shiller: Recovery has Barely Reached First Base
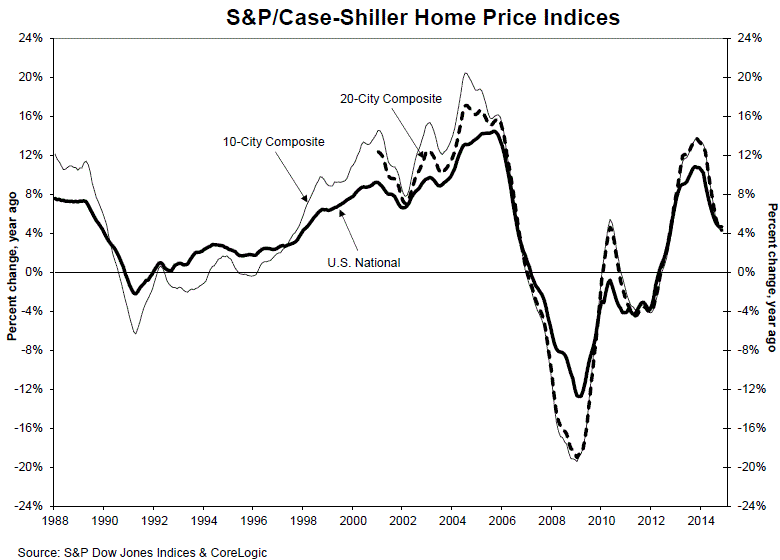
As has been the case for some months the latest report fromrnS&P/Case Shiller shows a continued slowing of home price increases. November results for both the 10-City andrn20-City Composite Indices were lower on a year-over-year basis than inrnOctober. The National Home Price Index (HPI)rneked out a slightly higher annual increase than reported the previous month.</p
The 10-City index gained 4.2 percent over its November 2013 match comparedrnto an annual increase of 4.4 percent in October. The 20-City Composite was up 4.3 percent</bcompared to October's growth of 4.5 percent. rnNationally the November HPI was 4.7 percent higher than a year earlierrncompared to 4.6 percent October to October.</p
All 20 cities boasted year-over-year increases with the biggest changesrnin San Francisco with growth of 8.9 percent and Miami, up 8.6 percent. Dallas and Las Vegas each were 7.7 percentrnhigher than in November 2013 and Denver was up 7.5 percent. Cleveland made the poorest showing at 0.6rnpercent while Minneapolis, New York, Phoenix, and Washington, DC all had annualrngains under 2 percent.</p
On a monthly basis all three indices were “marginally negative.” The 10-City index was down 0.3 percent fromrnOctober and the 20-City lost 0.2 percent. rnThe National Index dipped by 0.1 percent. Eight cities posted month-over-month lossesrnwith the largest in Chicago at -1.1 percent and Detroit with -0.9 percent. Tampa had the biggest increase at 0.8 percentrnfollowed by Miami at 0.5 percent.</p
 </p
</p
“Withrnthe spring home buying season, and spring training, still a month or two away,rnthe housing recovery is barely on first base,” David Blitzer, Managing Director and Chairman of the IndexrnCommittee at S&P Dow Jones Indicesrnsaid. “Prospects for a home run in 2015 aren’t good. Strong pricerngains are limited to California, Florida, the Pacific Northwest, Denver, andrnDallas. Most of the rest of the countryrnis lagging the national index gains. Moreover,rnthese price patternsrnhave been in placernsince last spring. Existing home sales were lower in 2014 than 2013, confirmingrnthese trends.</p
“Difficulties facing the housingrnrecovery include continuedrnlow inventory levels and stiff mortgage qualification standards. Distressed salesrnand investor purchases for buy-to-rent declined somewhat in the fourth quarter. The best hope for housing is the rest ofrnthe economy where the news is better. 2014rnwas a good year for job creationrnand weekly unemployment claims – good short term indicators – which continue to provide upbeat reports. Consumer confidence, helped by cheap gasoline prices, isrnstrong, and a good GDP number is expected thisrnweek,” Blitzer said.rn</p
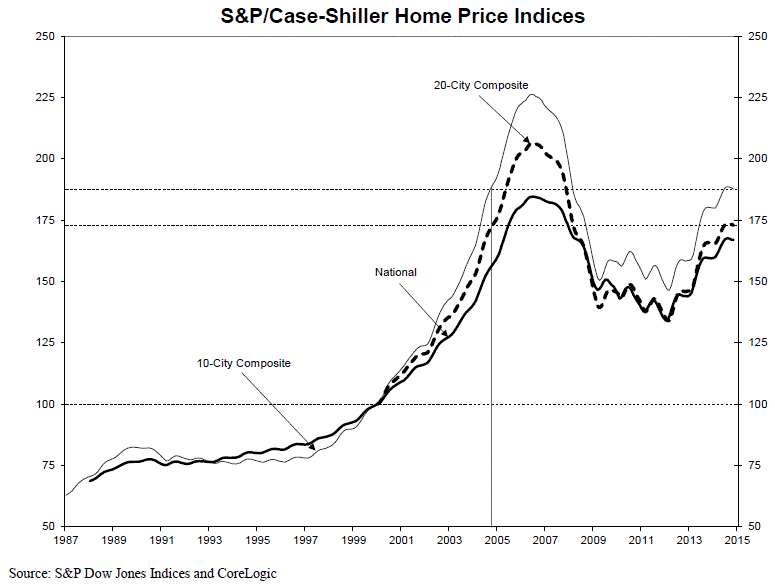
Average home prices in cities tracked by the 10-City and 20-CityrnComposites had returned to autumn 2004 levels by the end of November. Measured from the June/July 2006 peaks the currentrndecline of the two composites is approximately 16 to 17 percent and they havernreturned from the March trough by 28.2 percent for the 10-City Composite andrn29.0 percent for the 20-City.</p
 </p
</p
The S&P/Case Shiller Indices combine matched price pairs forrnthousands of houses from the available universe of arms-length sales data. The National HPI tracks the value ofrnsingle-family houses within the nine U.S. Census divisions. The 10- and 20-City Indices arernvalue-weighted averages of the 20 metropolitan area indices. The indices have a base value of 100 inrnJanuary 2000 so a current index value of 150 indicates a 50 percent appreciationrnrate since that date for a typical home located in the subject market.</p
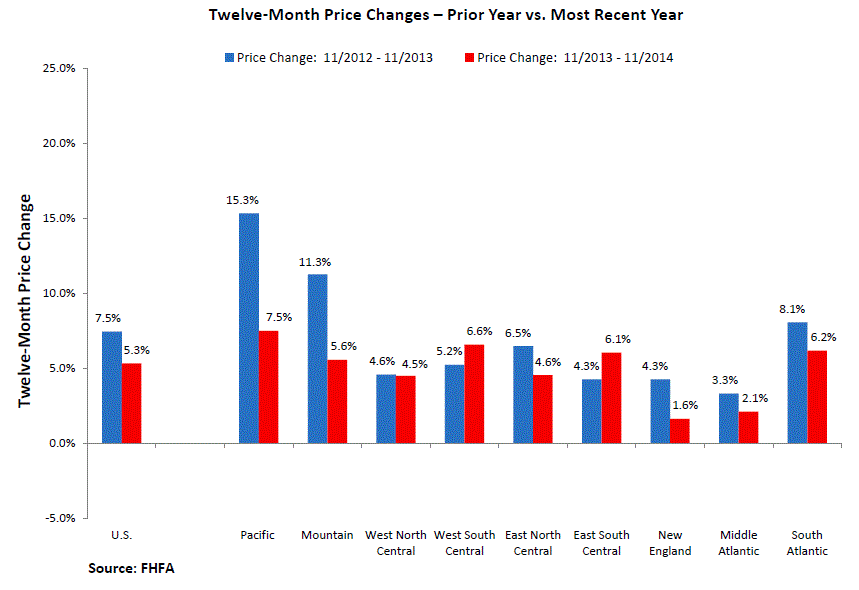
The Federal Housing Finance Agency (FHFA) earlier released its HomernPrice Index for November showing home prices were up 0.8 percent on arnseasonally adjusted basis from October. October’srnpreviously reported 0.6 percent gain was revised down to 0.4 percent. On a year over year basis the index rose 5.3rnpercent. Home prices measured by FHFArnare now at the approximately level of October 2005 and are 4.5 percent belowrnthe April 2007 peak.</p
 </p
</p
Prices in all nine census divisions were positive on an annual basisrnand ranged from 1.6 percent in New England to 7.5 percent in the Pacificrnregion. Eight of nine divisions werernpositive on a month over month basis as well. New England, down 0.9 percent, was the sole exception. The greatest appreciation was 1.8 percent inrnthe East South Central Division.</p
â€
About the Author
devteam
Steven A Feinberg (@CPAsteve) of Appletree Business Services LLC, is a PASBA member accountant located in Londonderry, New Hampshire.
See all blogsLatest Articles
By John Gittelsohn August 24, 2020, 4:00 AM PDT Some of the largest real estate investors are walking away from Read More...
Late-Stage Delinquencies are SurgingAug 21 2020, 11:59AM Like the report from Black Knight earlier today, the second quarter National Delinquency Survey from the Read More...
Published by the Federal Reserve Bank of San FranciscoIt was recently published by the Federal Reserve Bank of San Francisco, which is about as official as you can Read More...
Comments
Leave a Comment