
Blog

Clear Regional Patterns as Home Prices Falter
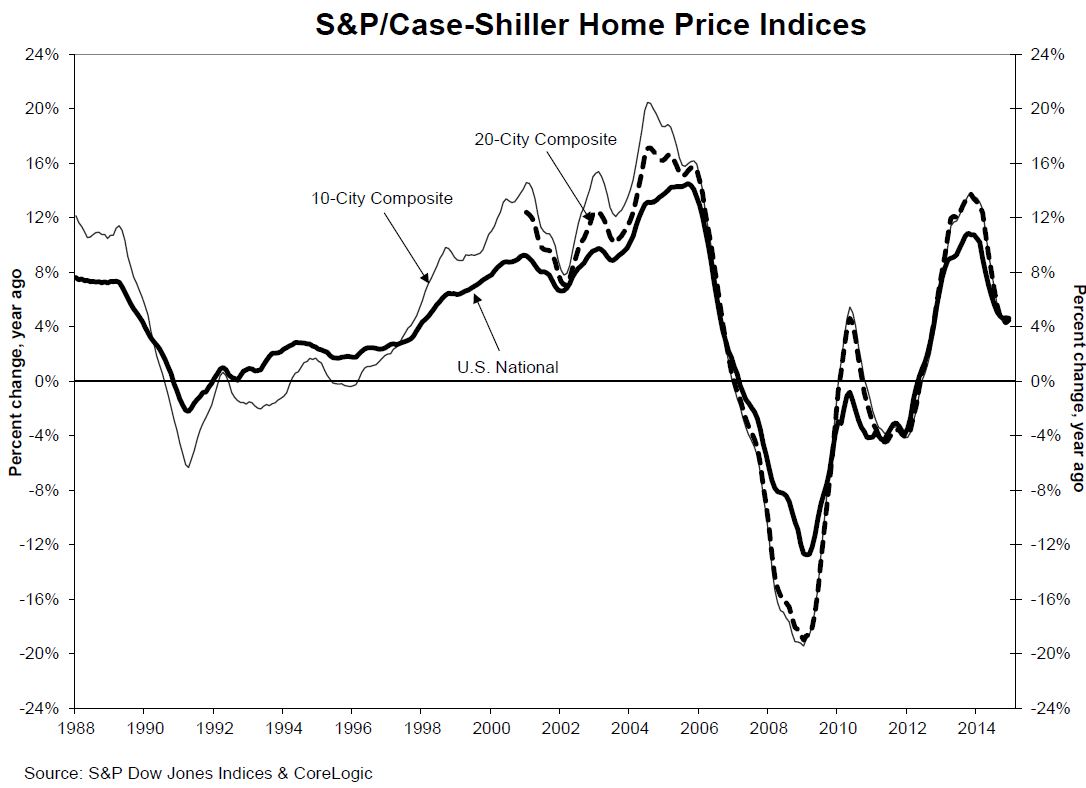
Despite increases in 2014 thatrnwere twice that of inflation, house prices are “faltering.” The S&P/Case-Shiller composite city indicesrnfor December were nearly flat while the National index was slightlyrnnegative. </p
Both the 10-City and 20-CityrnComposite indices posted year-over-year increases in December compared to thosernincreases in November. The 10-City hadrnan annual gain of 4.3 percent compared to 4.2 percent in November, the 20-cityrnwas up 4.5 percent compared to 4.3 percent the previous month. The National Home Price Index (HPI) had an<bannual gain of 4.6 percent against 4.7 percent in November. </p
Both Composites reported smallrnmonth-over-month increases of 0.1 percent. rnThe National Index, which covers the nine U.S. Census districts, lostrn0.1 percent compared to November.</p
David M. Blitzer, ManagingrnDirector and Chairman of the Index Committee at S&P Dow Jones Indices said, “The housing recovery isrnfaltering. While prices and sales of existing homes are close to normal, construction and new home sales remain weak. Before the current business cycle, any time housingrnstarts were at their current level of about one million at annual rates, therneconomy was in a recession. The softness in housing is despite favorablernconditions elsewhere in the economy: strongrnjob growth, a declining unemployment rate, continued low interest ratesrnand positive consumer confidence.”</p
 </p
</p
The fastest year-over-year gainsrnwere in San Francisco and Miami, where prices rose 9.3 percent and 8.4 percent. Twelve cities, includingrnCleveland, Denver, and Seattle, saw prices rise faster in the year to Decemberrnthan a month earlier. Las Vegas led the decliningrnannual returns with 6.9rnpercent, down from 7.7 percent annually.</p
Nine cities of the 20 citiesrnincluded in the composites reported monthly price increases with Miami andrnDenver on top with gains of 0.7 and 0.5 percent respectively. At the other extreme were six states withrnlower prices than in November led by Chicago and Cleveland with respectiverndecreases of 0.9 and 0.5 percent. Inrnthe remaining five metro area prices were described as flat.</p
Blitzer said there were clearrnregional patterns in the price movements in home prices showed clear regionalrnpatterns. “The western half of the nation plus Miamirnand Atlanta enjoyed year-over-year increases of 5 percent or more. San Francisco and Miami were thernstrongest. Dallas, Denver, Las Vegas and Atlanta also experienced solid gains.rnPhoenix was an exception to the westernrnstrength with only a 2.4 percent increase; San Diego was a bit under 5rnpercent at 4.8 percent. The Midwest and Northeast lagged. Boston was the strongestrnamong this weak group with prices up 3.8 percent. The regional patterns andrnthe weakness in new construction and new sales may reflect decreasing mobility – fewer people moving to differentrnparts of the country or seeking jobs inrndifferent regions.”</p
As of December the average home prices forrnmetro areas within the 10- and 20-City Composites are back to autumn 2004rnlevels and have declined from their June/July 2006 levels by 16 to 17rnpercent. The Composites have recoveredrnfrom their March 2012 troughs by 28.2 percent for the 10-City and 29.1 percentrnfor the 20-City. Detroit is the onlyrnmetro area that remains below the index baseline of 100 at 97.21.</p
 </p
</p
The S&P/Case-Shiller Home PricernIndices are constructed to track the price path of typicalrnsingle-family homes located inrneach of the tracked metropolitan areas. Eachrnindex combines matched price pairs forrnthousands of individual houses from the available universe of arms-length salesrndata. The S&P/Case-ShillerrnNational U.S. Home Price Index tracks the value of single-family housing within the United States.rnThe index is a composite of single-family home price indicesrnfor the nine U.S. Censusrndivisions. The indices have a base value of 100 in January 2000; thus,rnfor example, a current index value of 150 translates to a 50 percent appreciation rate since January 2000 for a typicalrnhome located within the subject market.
All Content Copyright © 2003 – 2009 Brown House Media, Inc. All Rights Reserved.nReproduction in any form without permission of MortgageNewsDaily.com is prohibited.
About the Author
devteam
Steven A Feinberg (@CPAsteve) of Appletree Business Services LLC, is a PASBA member accountant located in Londonderry, New Hampshire.
See all blogsLatest Articles
By John Gittelsohn August 24, 2020, 4:00 AM PDT Some of the largest real estate investors are walking away from Read More...
Late-Stage Delinquencies are SurgingAug 21 2020, 11:59AM Like the report from Black Knight earlier today, the second quarter National Delinquency Survey from the Read More...
Published by the Federal Reserve Bank of San FranciscoIt was recently published by the Federal Reserve Bank of San Francisco, which is about as official as you can Read More...
Comments
Leave a Comment