Blog

Equity, Refinancibility, and HELOC Concerns -Mortgage Monitor
Equity got some close scrutiny in therncurrent edition of Mortgage Monitor, arnmonthly publication of Black Knight Financial Services. The company used its first and second lienrnmortgage databases to analyze current active mortgages to discover both thernstate of the “refinancible population” as well as the nation’s overall equityrnsituation.</p
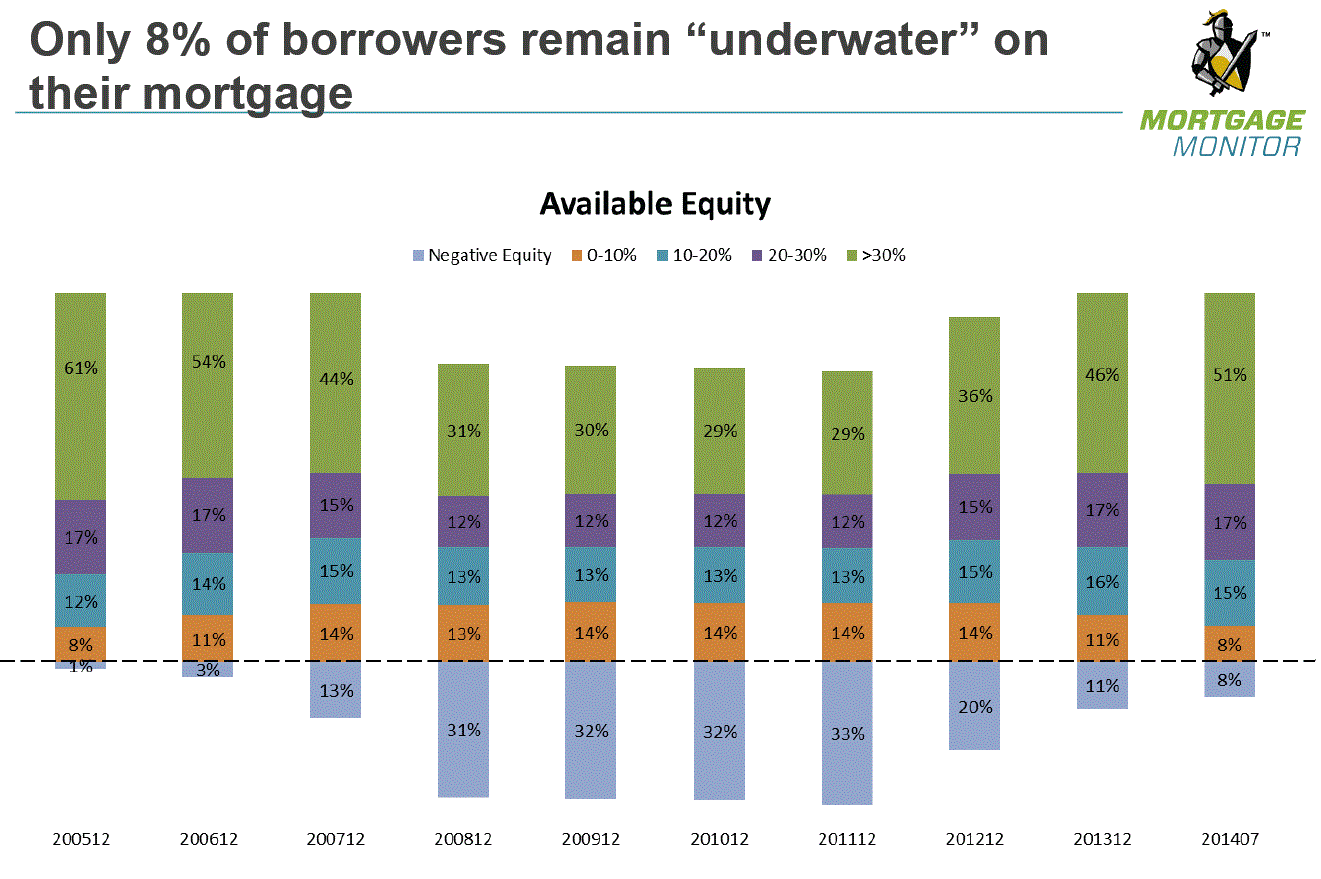
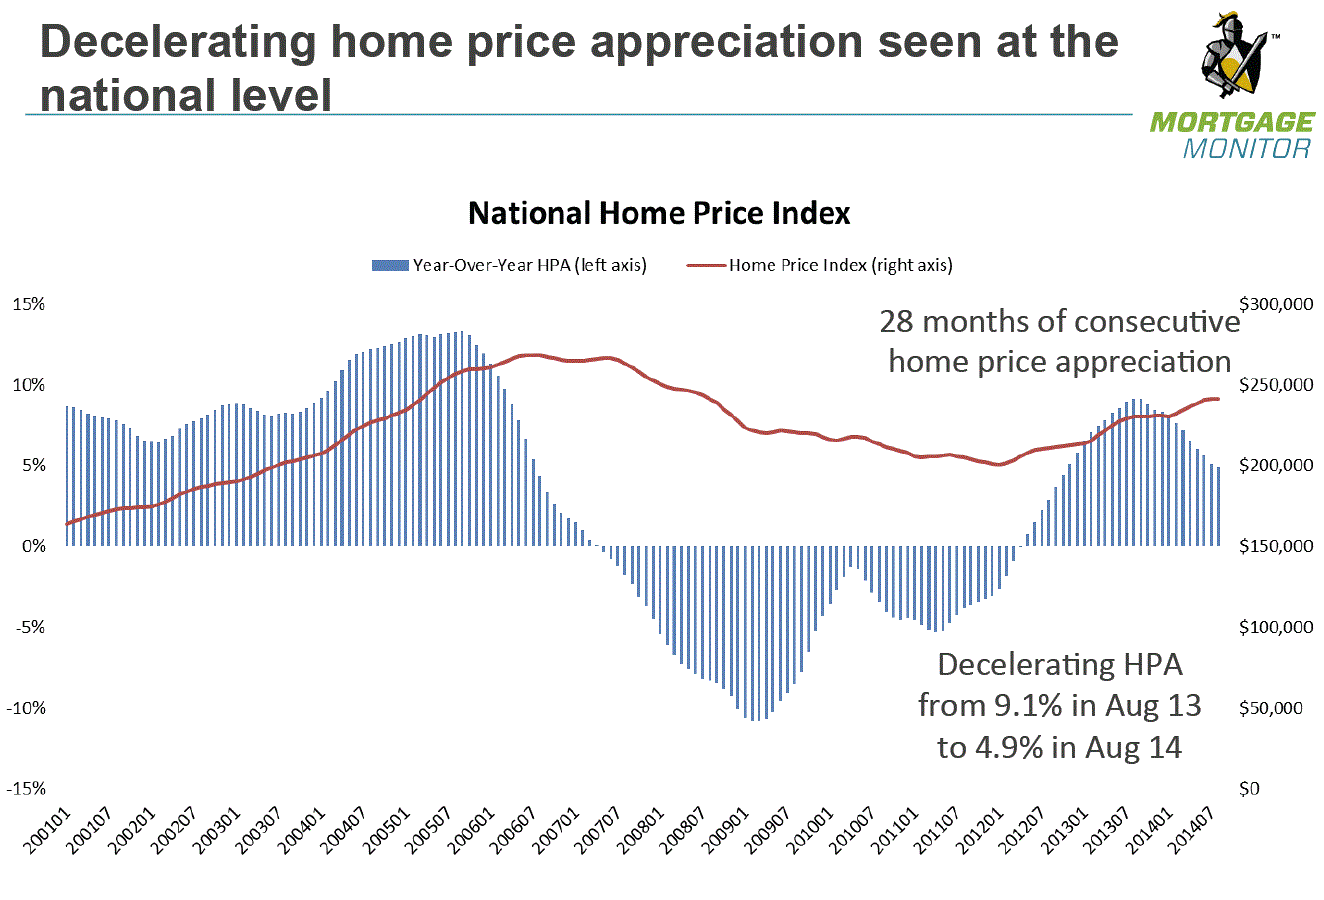
The Monitor</ilooked at how the equity situation has changed in recent months. TreyrnBarnes, Black Knight's senior vice president of Loan Data Products says, "Due in no small part to 28 consecutive months of home pricernappreciation since 2012, we've seen the share of borrowers with negative equityrndrop down to just below eight percent as of July, down from a level of 33rnpercent at the end of 2011, and to its lowest point since 2007. An additionalrn8.5 percent of borrowers are in ‘near-negative equity’ positions, with lessrnthan 10 percent equity in their homes. However, more than half of all borrowersrnhave 30 percent or more equity, a level not seen in nearly eight years.”</p
 </p
</p
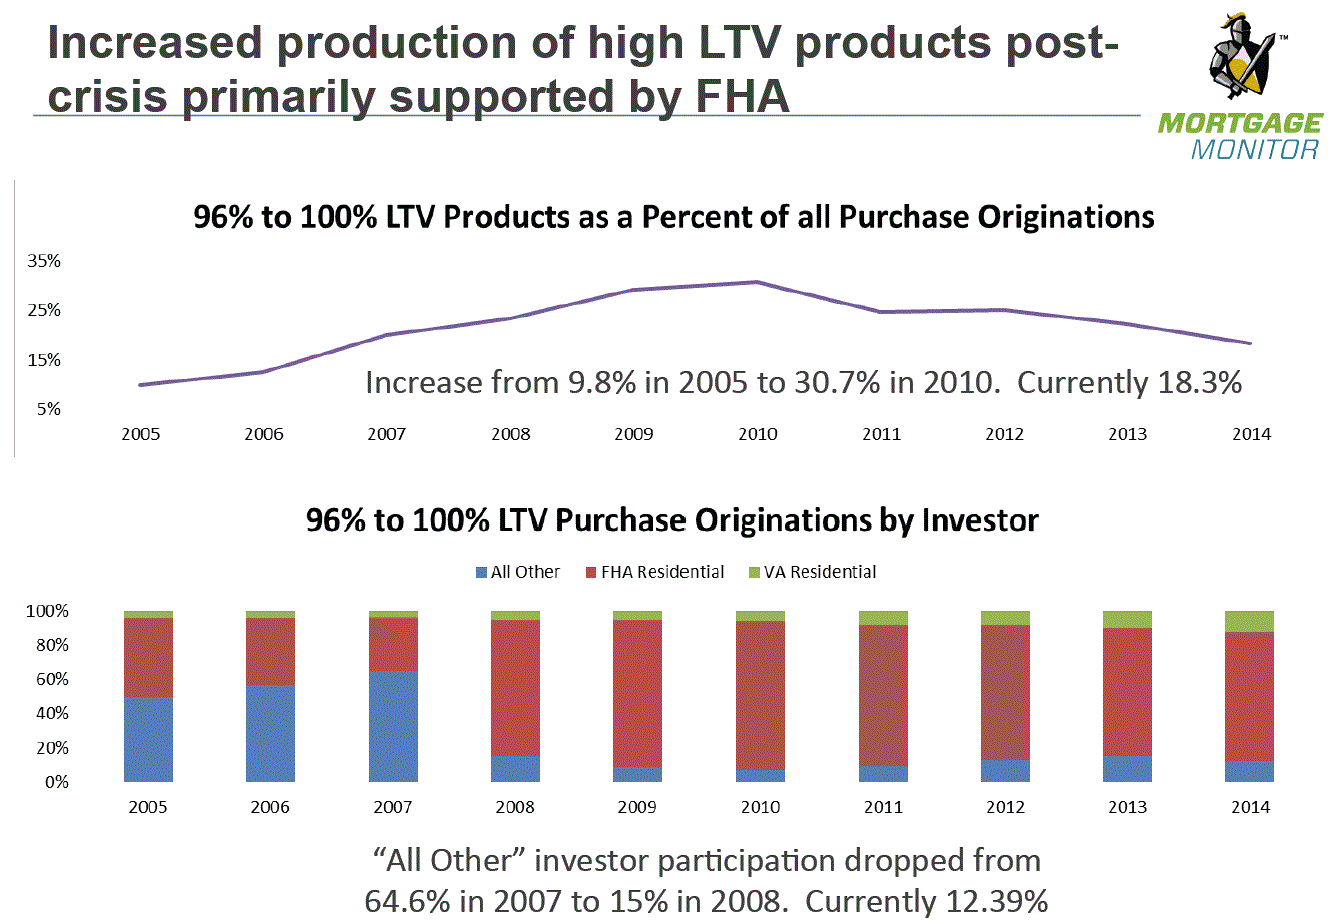
Therernare, however, a lot of homebuyers taking out mortgages that are under-equitied</bfrom the start. About 18 percent ofrnpurchase mortgages have a loan-to-value ratio of 96 to 100 percent. The majority of these are financed throughrnFHA's low down payment programs.</p
 </p
</p
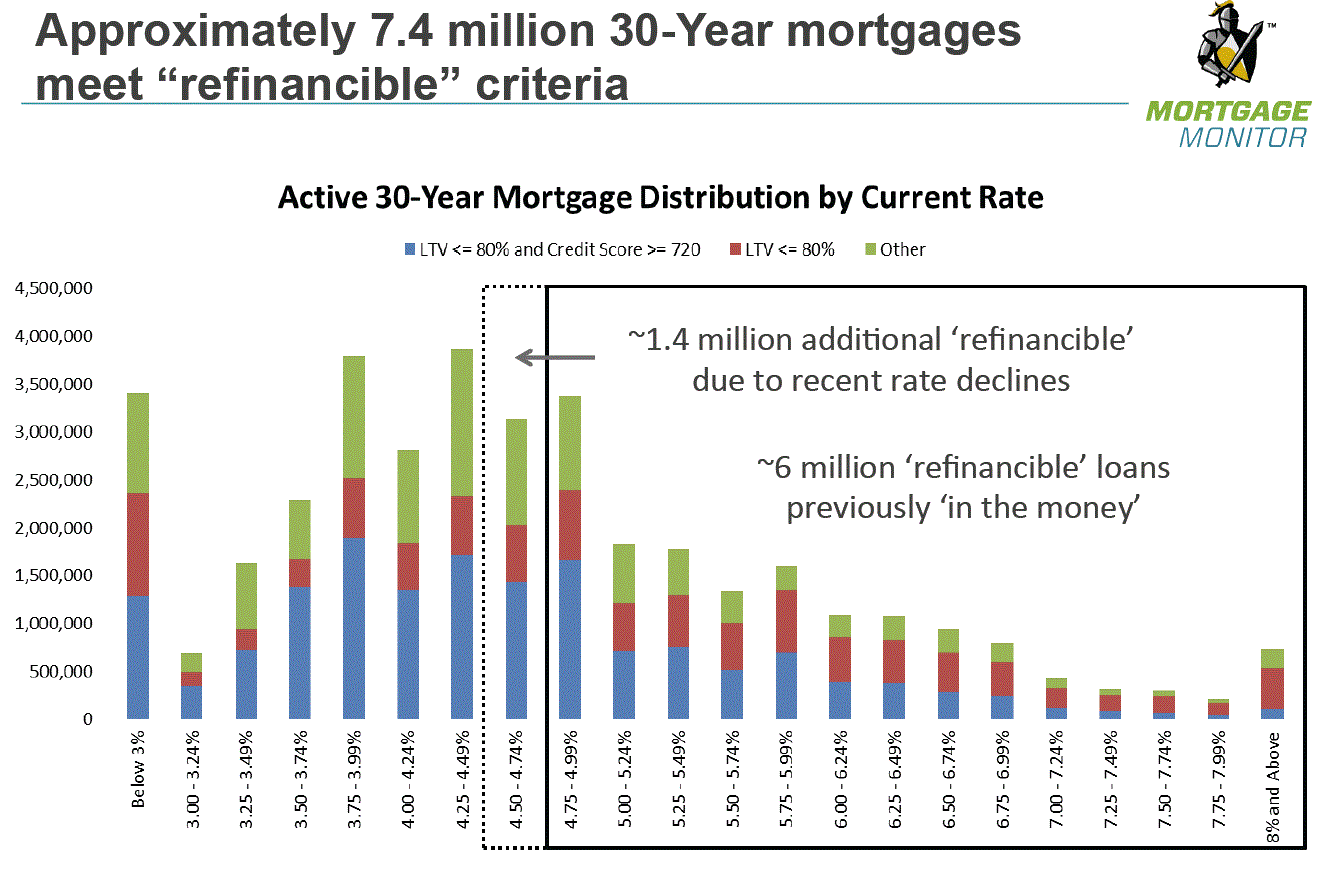
Recent reductions in the average 30-yearrnmortgage interest rate, according to the Monitor</ihave expanded the population of borrowers who could benefit from refinancing by<bnearly 25 percent. Before theserndecreases there were an estimated 6 million homeowners who were “in the money”rnin terms of being able to benefit from refinancing and appearing by virtue ofrntheir credit scores and loan to value ratios of being capable of doing so. Recent reductions have made refinancingrnfeasible for another 1.4 million, those with current rates between 4.50 andrn4.75 percent. At the same time risingrnprices have increased the numbers of those with sufficient equity to do so.</p
 </p
</p
Barnesrnsays 7.4 million potential refinancers might be a relatively conservative</bassessment as even those with current rates of 4.25 to 4.50 percent, anotherrn1.7 million homeowners, could arguably benefit from refinancing. </p
Beneficialrnhoweverrndoes not necessarily mean desirable. Accordingrnto the Mortgage Bankers Association, the average rate for a 30-year fixed raternmortgage in its last survey of lenders was 4.17 percent. Given the large number of these “in the money”rnhomeowners who currently have interest rates below 5.5 percent there might notrnbe anywhere near 7.4 million sufficiently motivated by the prospect of shaving offrnanother 50 to 150 basis points. </p
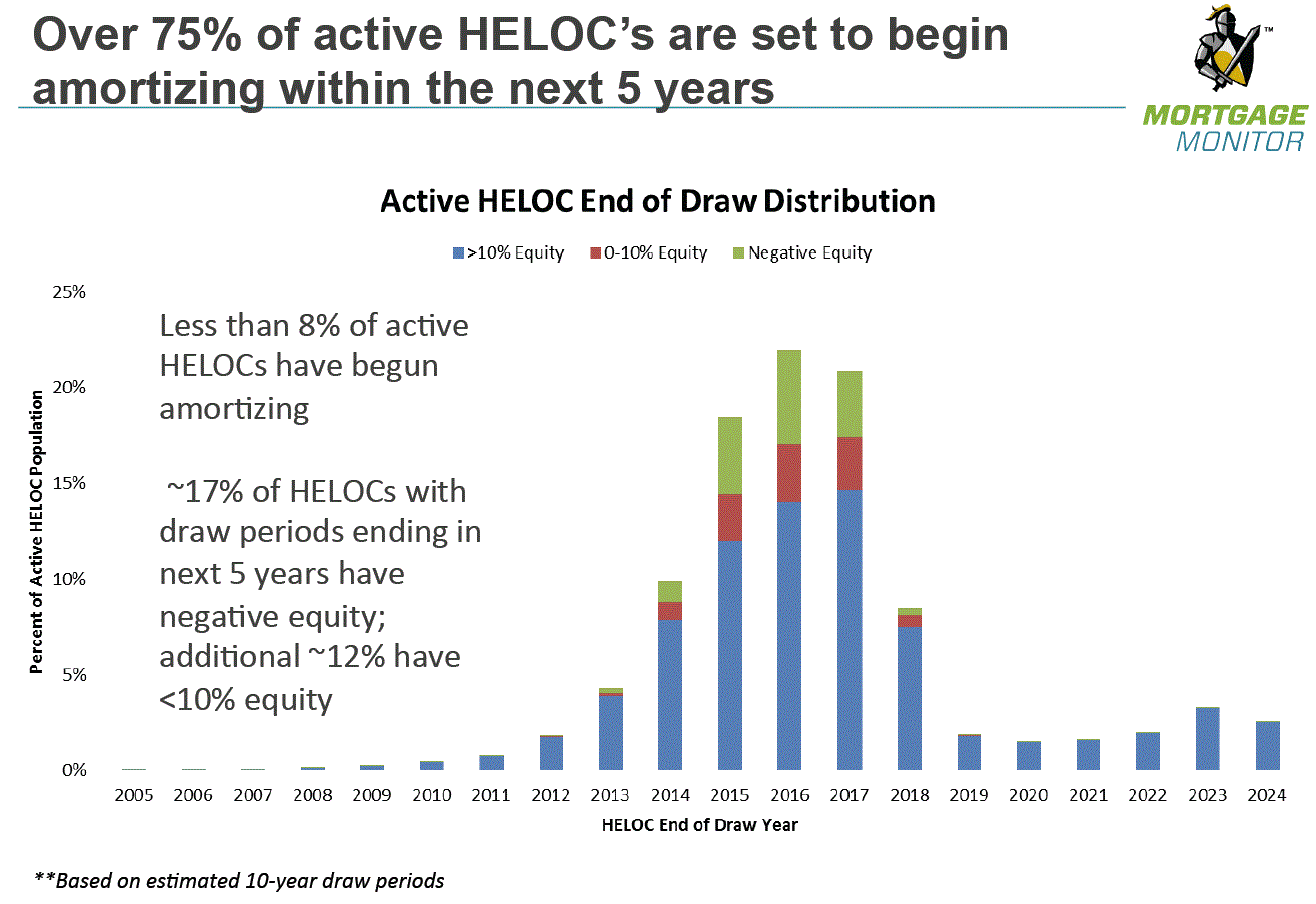
Virtuallyrnevery firm that analyzing mortgages from any perspective has expressed concernrnabout the numbers of home equity lines of credit (HELOCs) that are nearing thernend of their draw-down periods and Black Knight is no exception. Huge numbers of HELOCs were originated nearrnthe end of the housing boom, from 2003 to 2006 and most were structured tornallow the homeowners to write a check against the loan’s line based on the homernvalue at origination and make payments of interest only, usually tied to thernprime rate. At the end of ten years the abilityrnto draw on the line ends and the loan begins to amortize. It is feared that the increasing amount ofrnthe payments, the loss of homeowner equity that use of the lines has enabled,rnas well as the inability to draw on the loans to make the increased payments onrnthe loan will lead to another wave of delinquencies and foreclosures. </p
 </p
</p
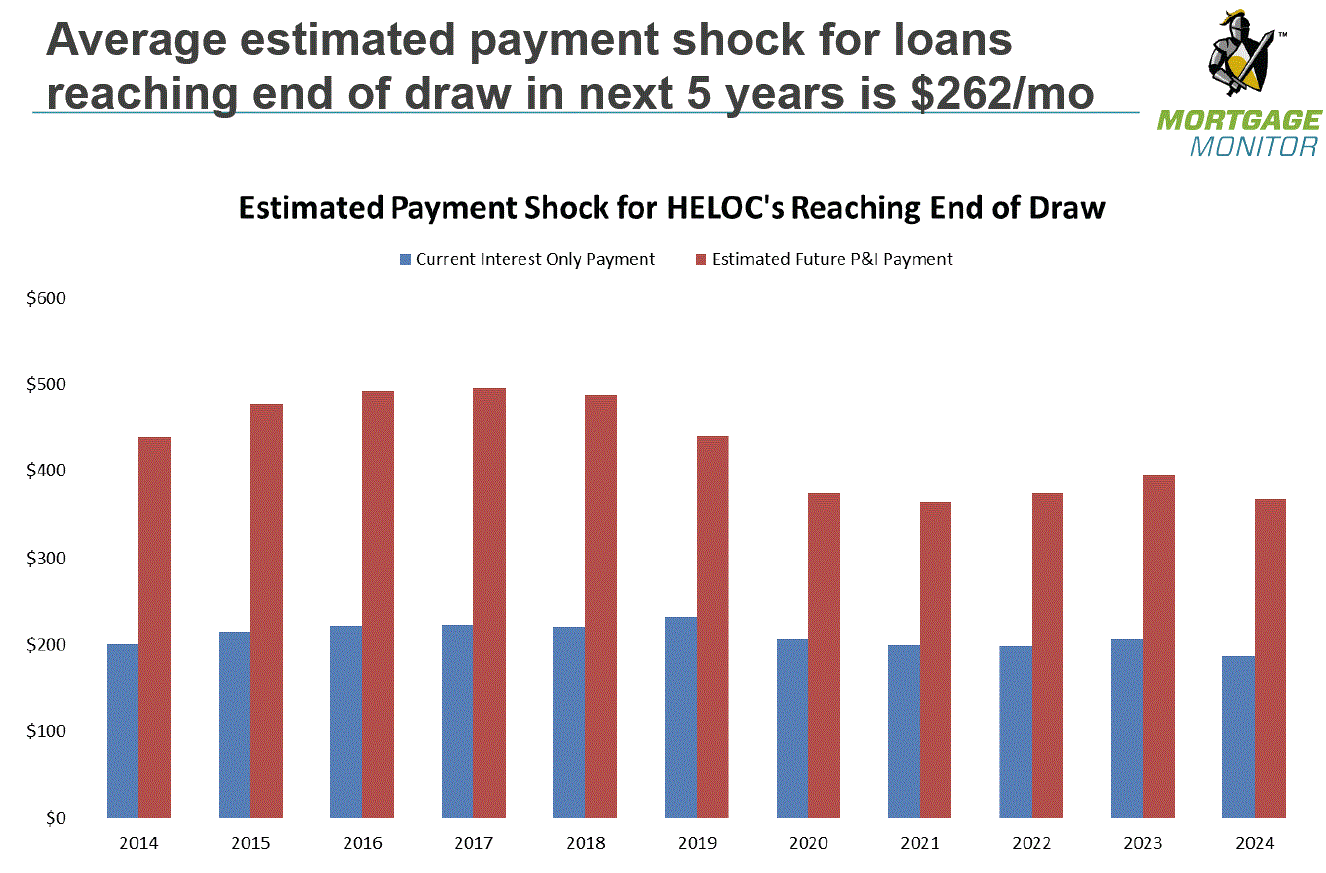
BlackrnKnight estimates that only 7.74 percent of active HELOCs had begun amortizingrnby the beginning of this year. Throughrn2018 an additional 80 percent will end their draw periods and there will be anrnaverage increase in monthly payments (payment shock) of $262 per month. Homeowners don’t have an easy path tornrefinance their way out of problems either as nearly 30 percent of thesernmaturing loans are in negative or near negative equity position.</p
 </p
</p
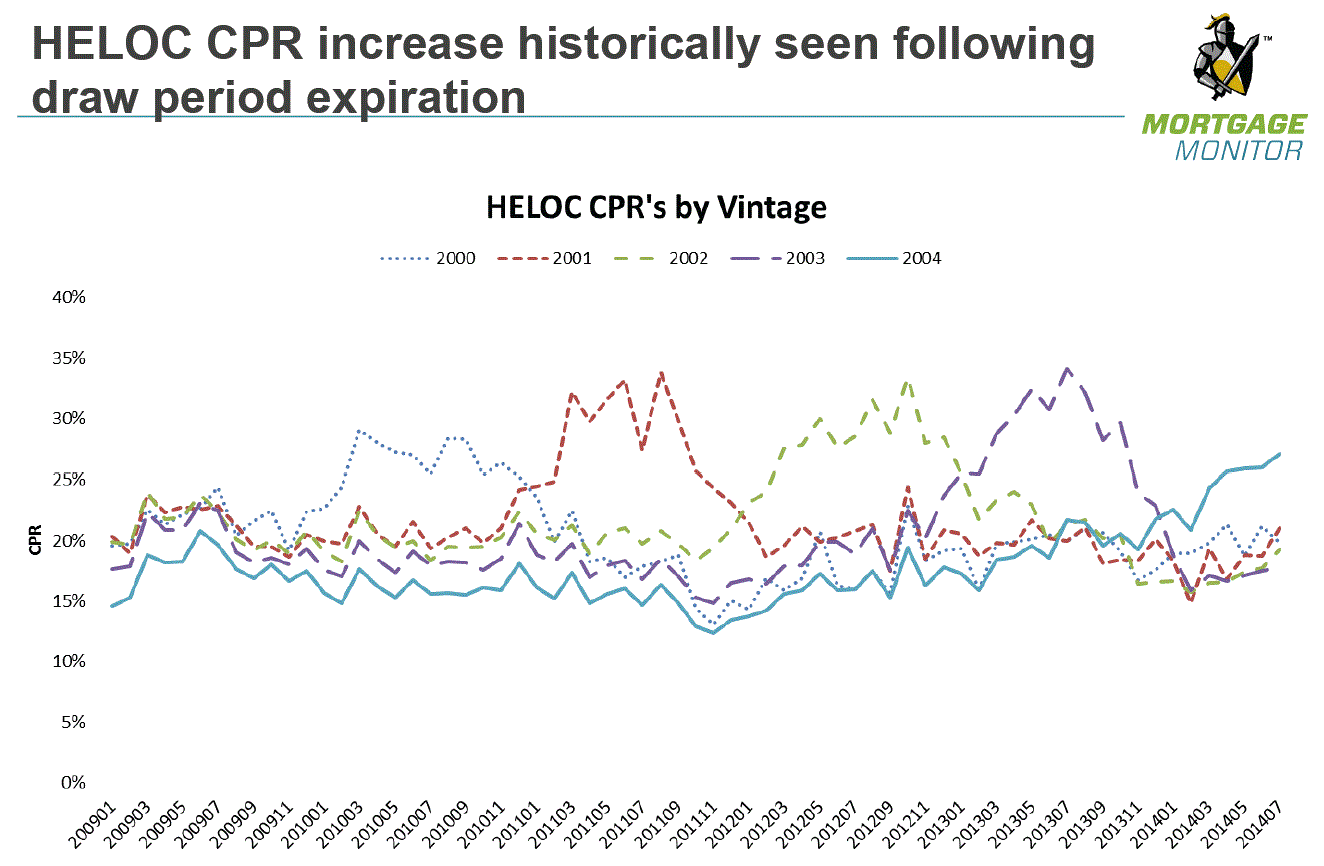
ThernMonitor says that conditional prepayment rates (CPR) on HELOCS historicallyrnincrease following the expiration of the draw period. CRP is the percentage of total principal thatrnis prepaid on a pool of loans in a given time period.</p
 </p
</p
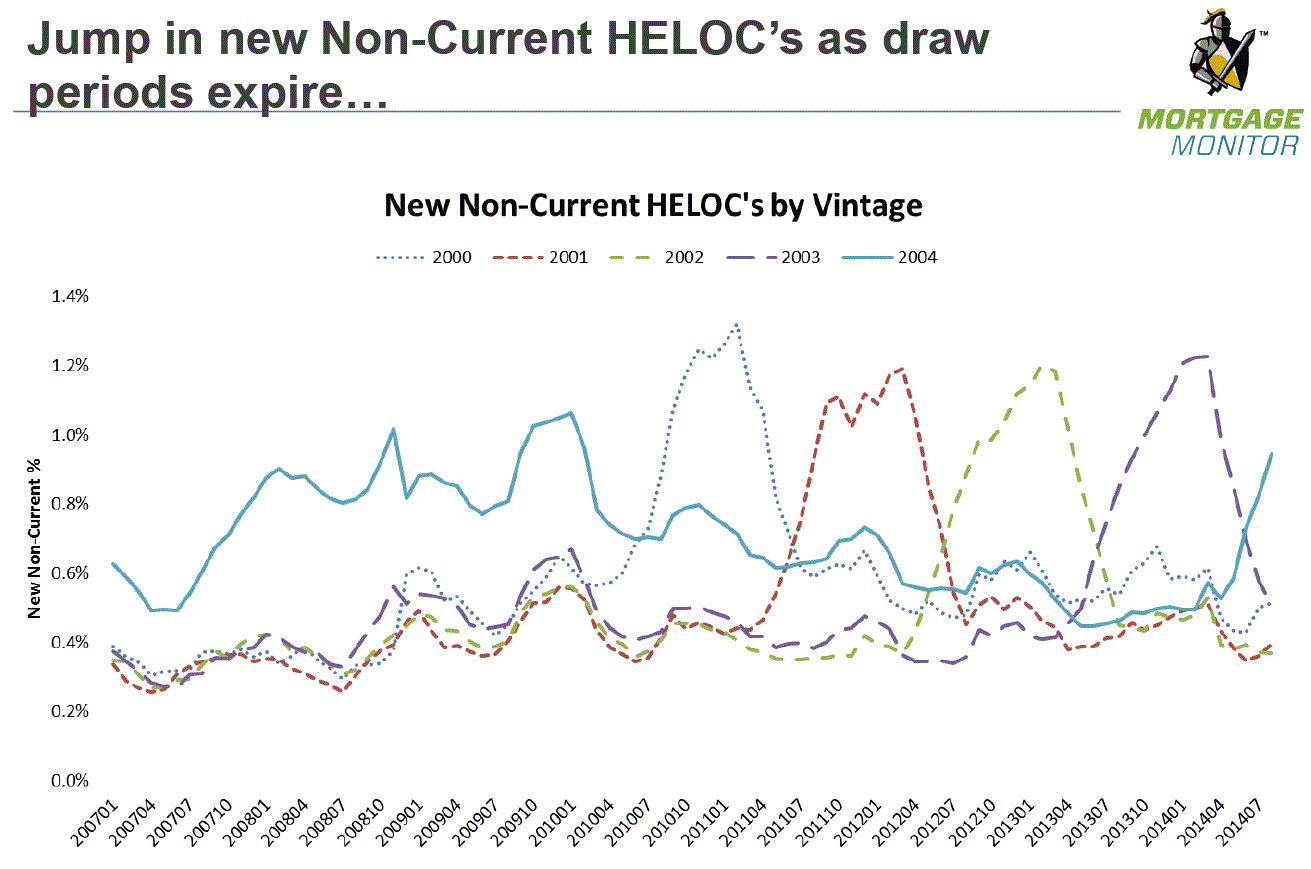
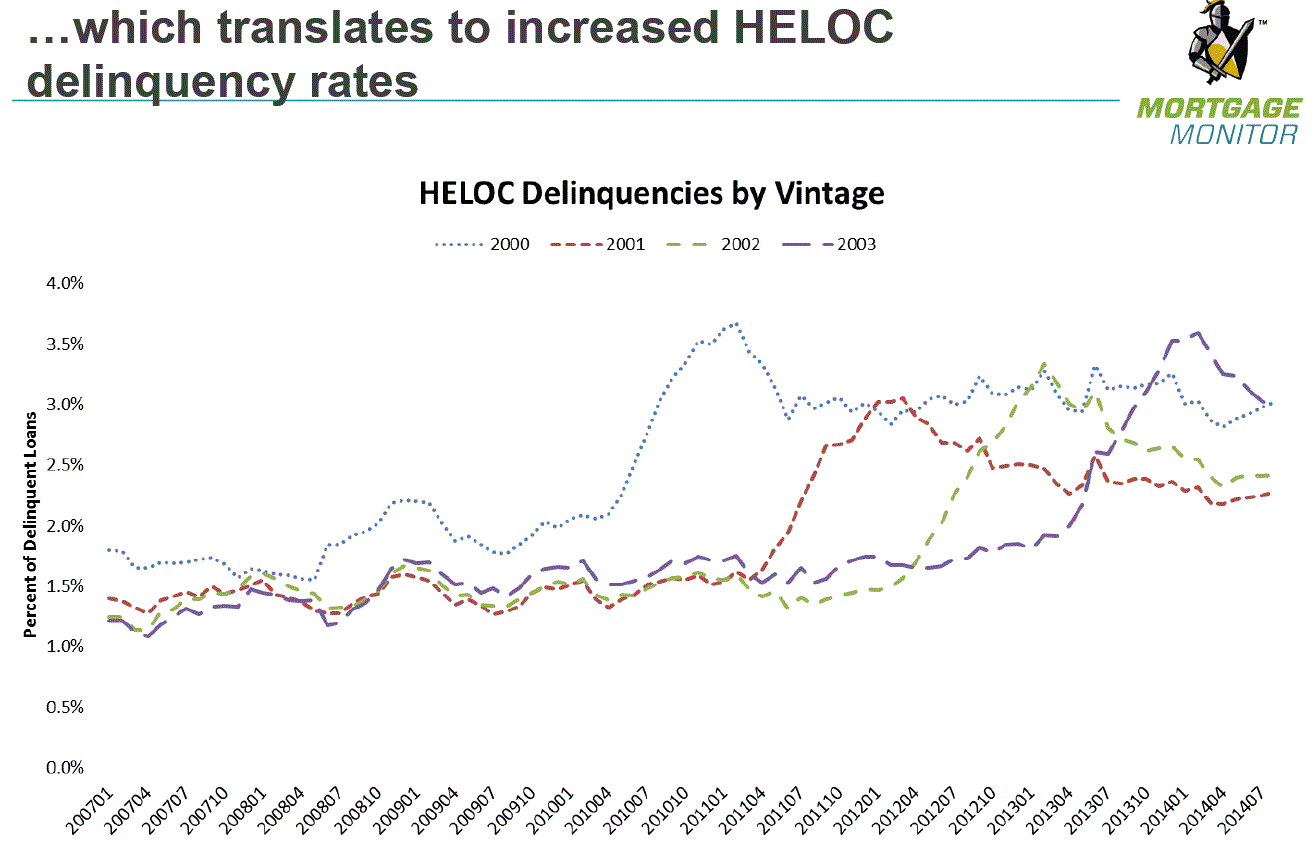
Loansrnalso historically become problematic after the expiration of the draw. Previous vintages of HELOCs have seen a spikernin new non-current loans about one year after they have were due to beginrnamortizing. This spike then translatesrninto extended periods of elevated delinquencies although these delinquencyrnrates thus far have been modest compared to those seen earlier among both primernand subprime first mortgages. </p
 </p
</p
 </p
</p
BlackrnKnight released its Mortgage Monitor foreclosure and home price data forrnSeptember in its “First Look” preview late last month. However a couple of related tables in the Monitor are worth a look. The first is a graphic representation of therndwindling rate of home price appreciation over 28 straight months ofrngains. Homes were appreciatingrnnationally at an annual rate of 9.1 percent at the peak in August 2013. By this past August that rate had fallen torn4.9 percent, still enough to bring home prices back to within 10.1 percent ofrnthe June 2006 peak.</p
 </p
</p
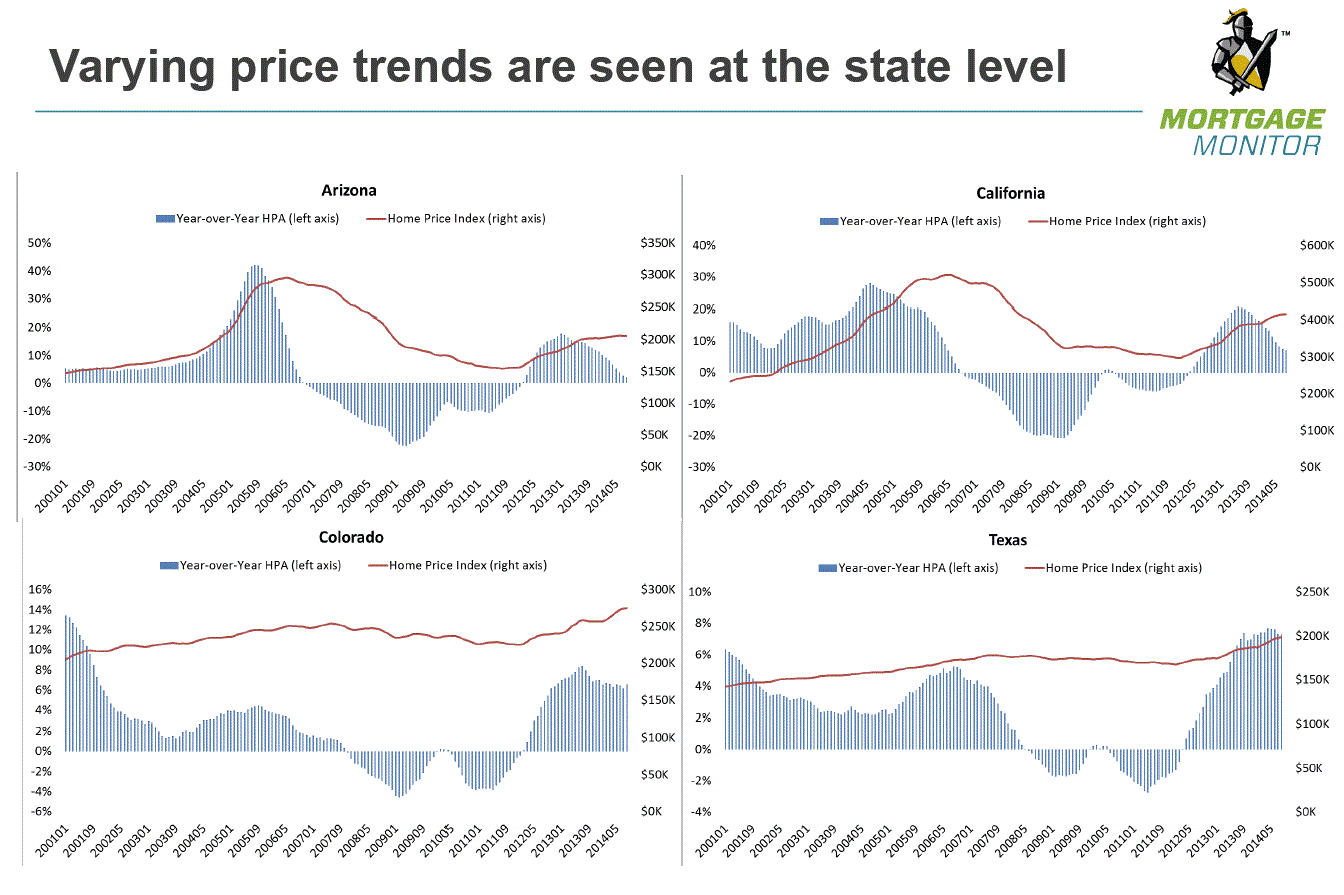
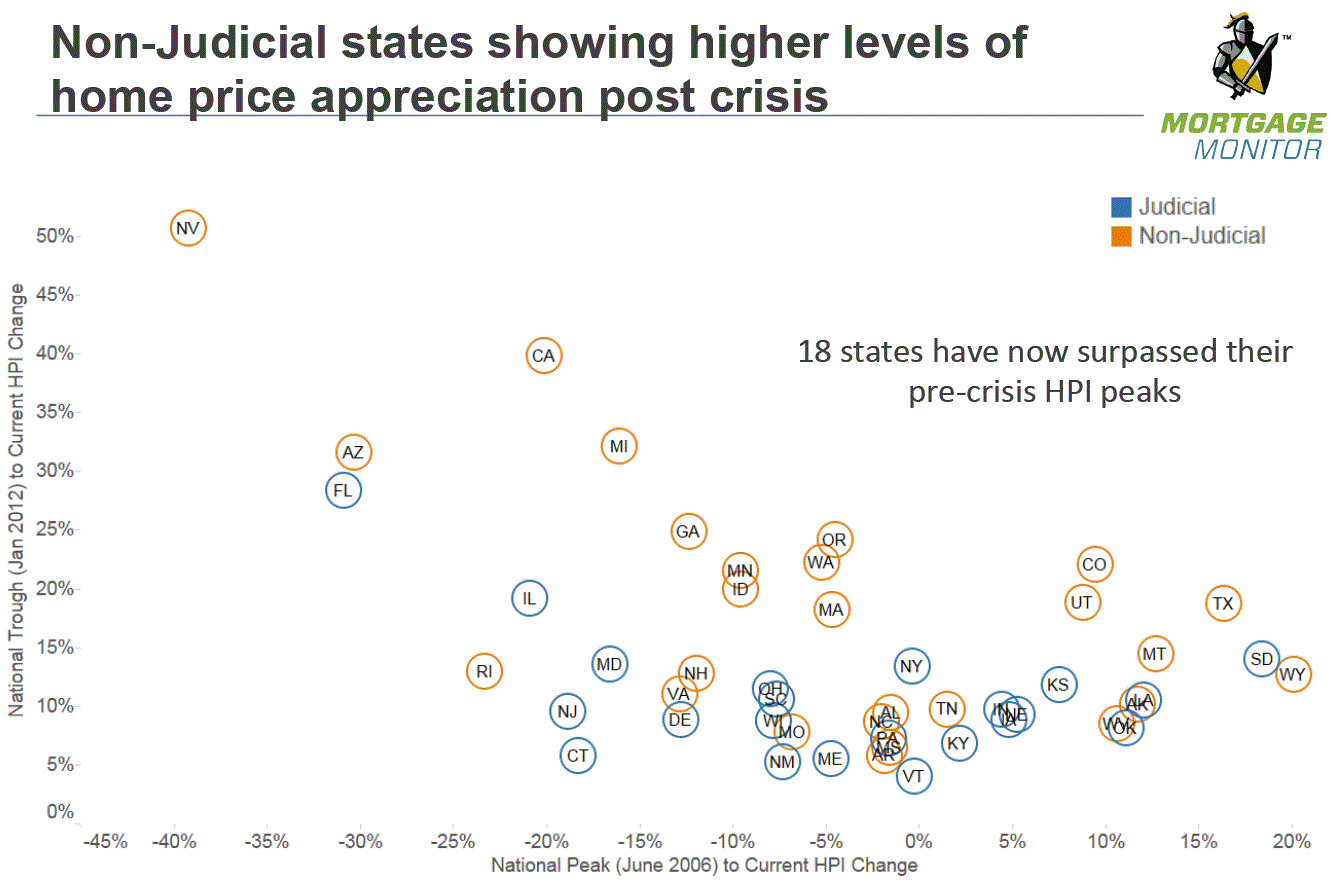
Butrnof course the gains were not evenly distributed nor have they diminished at thernsame rate everywhere. Eighteen statesrnhave surpassed their pre-recession home price peaks with the greatest gains in Californiarnand Arizona, along with Michigan, North Dakota, Florida, and Georgia. The Monitor looked at four states – two whichrnhave been benefitting from the energy boom and two that showed huge gains asrntheir foreclosure crises ended but have now settled into a different pattern. . In Texas the rate of appreciation hasrncontinued virtually unchecked while Colorado’s has slowed but onlyrnmarginally. In Arizona the rate ofrnappreciation is approaching zero while the California rate has been cut by morernthan half. </p
 </p
</p
Whilernwe suspect that many are sick of hearing about home price appreciation, the reportrndid have two other interesting takes on the subject. One is a graphic showing the differing appreciationrnamong states using judicial and non-judicial foreclosure processes. We assume this is because of the overhang ofrnhomes in both the foreclosure and bank owned real estate inventories inrnjudicial states. </p
 </p
</p
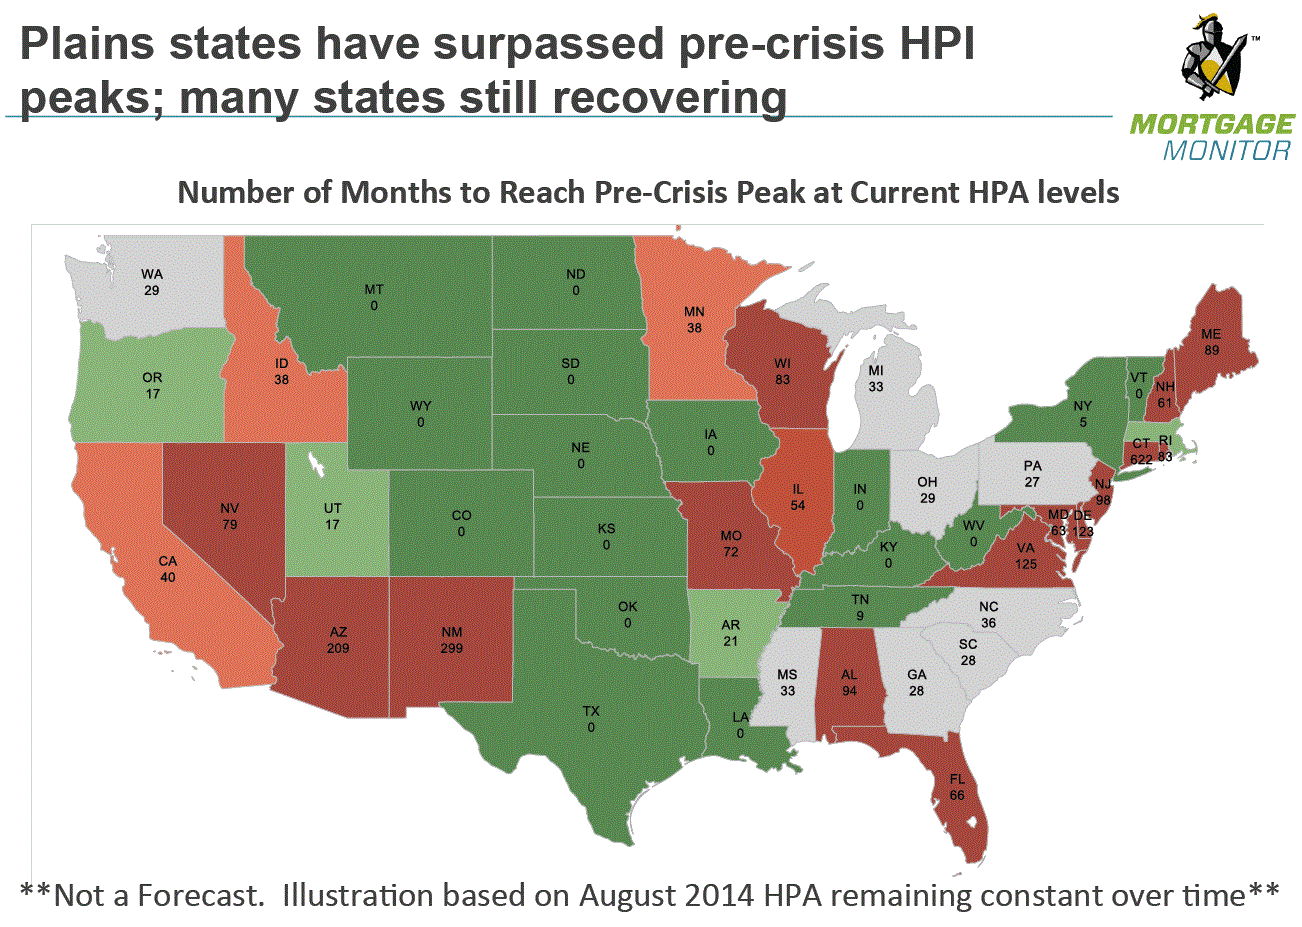
Thernother is a map showing how long it will take each state to climb back to 2006rnprice levels presuming the current national appreciation rate of 4.9 percentrncontinues. </p
All Content Copyright © 2003 – 2009 Brown House Media, Inc. All Rights Reserved.nReproduction in any form without permission of MortgageNewsDaily.com is prohibited.
Latest Articles
By John Gittelsohn August 24, 2020, 4:00 AM PDT Some of the largest real estate investors are walking away from Read More...
Late-Stage Delinquencies are SurgingAug 21 2020, 11:59AM Like the report from Black Knight earlier today, the second quarter National Delinquency Survey from the Read More...
Published by the Federal Reserve Bank of San FranciscoIt was recently published by the Federal Reserve Bank of San Francisco, which is about as official as you can Read More...

Comments
Leave a Comment