
Blog

February Foreclosure Activity Trends Down after January Surge
After a sharp increase in January, foreclosure starts and sales have reverse direction and resumed the steady decline they began in mid-fall. The February Mortgage Monitor Report published by Lender Processing Servicers (LPS) showed foreclosure starts down 15 percent from January to 172,602, 15.4 percent lower than during the same period in 2011. Foreclosure sales decreased 19 percent from January to a total of 74,229. Foreclosure sales were down 22 percent in judicial states compared to January and 19 percent in non-judicial states.</p
 </p
</p
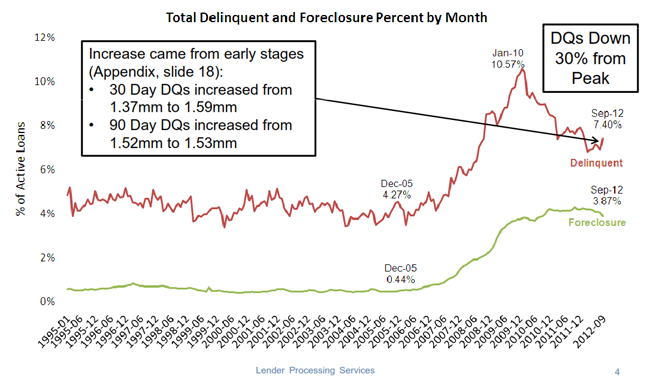
The national delinquency rate in February was 7.57 percent, down 5.0 percent from the 7.97 rate in January and 14.0 percent lower than in February 2011 when it was 8.80. The seriously delinquent loan rate was 7.58 percent compared to 7.69 percent and 8.24 percent during the two earlier periods.</p
LPS says that while the January increase in foreclosure sales was most pronounced in loans held in bank portfolios, the drop in February was across all investor classes. Both the increase in January and the reversal in February were closely tied to GSE performance.</p
 </p
</p
Despite the broad-based February improvement, national pipeline ratios continue to decline off their peaks but the changes vary sharply by geography. At the end of February the average pipeline ratio in judicial states was 84 months as compared to 33 months in non-judicial states. The ratios are highest in the Northeast, notably in New York and New Jersey where the average pipelines are 846 months and 772 months respectively.</p
 </p
</p
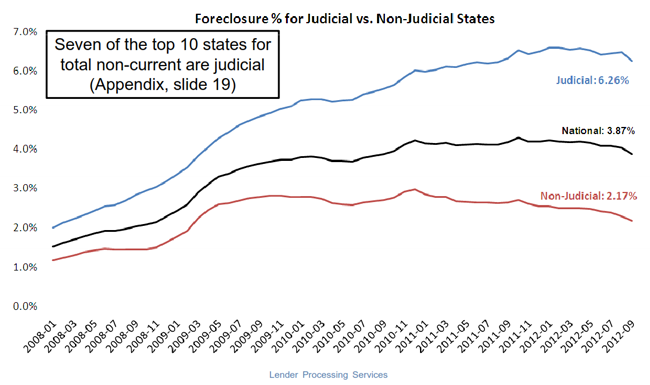
The foreclosure inventory stands at 4.13 percent nationally, 0.5 percent lower than January and 0.3 percent below February 2011 figures but again there are sharp differences between judicial and non-judicial states. In Judicial states the rate is 6.52 percent and climbing; in non-judicial states the rate is 2.43 percent and trending down.</p
 </p
</p
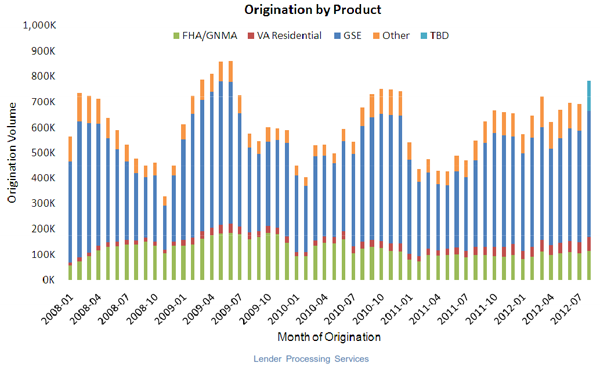
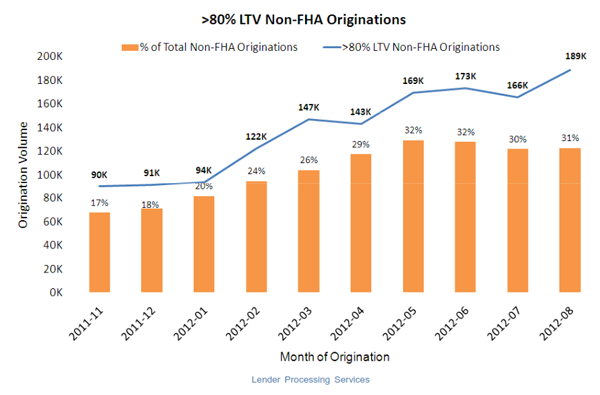
New mortgage originations remain depressed, continuing a four-month decline. Origination data for January shows a decrease to 450,000 originations compared to over 500,000 in November 2011. </p
All Content Copyright © 2003 – 2009 Brown House Media, Inc. All Rights Reserved.nReproduction in any form without permission of MortgageNewsDaily.com is prohibited.
About the Author
devteam
Steven A Feinberg (@CPAsteve) of Appletree Business Services LLC, is a PASBA member accountant located in Londonderry, New Hampshire.
See all blogsLatest Articles
By John Gittelsohn August 24, 2020, 4:00 AM PDT Some of the largest real estate investors are walking away from Read More...
Late-Stage Delinquencies are SurgingAug 21 2020, 11:59AM Like the report from Black Knight earlier today, the second quarter National Delinquency Survey from the Read More...
Published by the Federal Reserve Bank of San FranciscoIt was recently published by the Federal Reserve Bank of San Francisco, which is about as official as you can Read More...
Comments
Leave a Comment