
Blog

FHA Study Finds Layering Bigger Risk than High LTV
TwornGeorge Washington University professors have called current discussions andrnproposals to curtail FHA’s low down payment loans an overreaction. Robert Van Order, Professor of Finance and Anthony Yezer Directorrnof the Center for Economic Research, both at George Washington University’srnSchool of Business are authors of a multi-installment FHA Assessment Reportrnwhich seeksrnto identify the factors that are determinants of mortgage risk, i.e. downrnpayments, credit scores, and debt-to-income levels, to ensure that FHA doesn’trnlayer on excessive risk.</p
Inrnthe third installment released on Monday the authors state that, if all we knewrnabout loans was their down payment we should want to control it closely butrnmortgage lending is more complicated than a single dimension can capture andrncredit risk is determined by a combination of factors with tradeoffs amongrnthem. “It is possible to do low downrnpayment lending profitably, but not in a vacuum, and it need not be muchrnriskier than high down payment lending,” they said.</p
Thernthird installment looks at three specific issues. </p<ul class="unIndentedList"<liTherntrade-offs among readily observable loan characteristics. </li<liThernrisk of different loan types as measured by their variability or sensitivityrnover the housing cycle.</li<liFactorsrnthat are not so readily observable such as the source of the down payment thatrnare important and need to be considered when evaluating the relationshiprnbetween LTV and future default.</li</ul
Whilernthere is evidence that lack of equity in a property is a determining factor inrnpredicting default, it may not mean that loans are riskier for this reasonrnalone. Historically, low down paymentrnloans tend to have higher default rates, however neither this or higher foreclosurernrates are necessarily the same as higher risk. rnRisk is about deviations from the mean, not the size of the mean. High LTV rates are priced by the FHA and ifrndefaults turn out as expected, profits will also be as expected with higherrnprices offsetting increased losses. Thernrisk question is how unstable profits are when there are shocks to defaultrnrates. </p
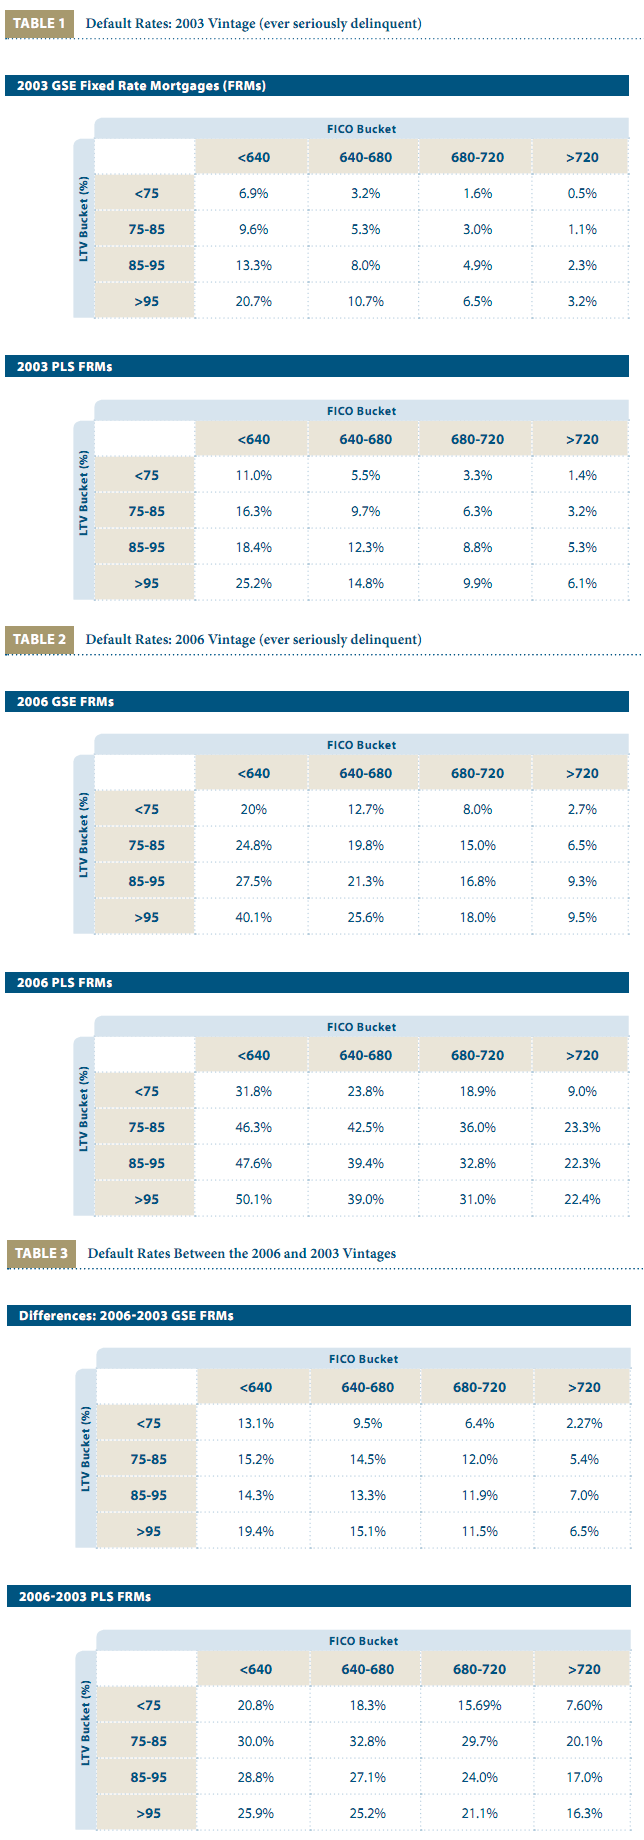
Bothrnhigh and low LTV loans had unusually high losses during the recent housingrncrisis so it is necessary to compare the increases in losses for differentrntypes of loans and loan underwriting characteristics. The following tables look at FanniernMae/Freddie Mac (GSE) loans and private label securities (PLS) loans originatedrnin 2003 when the economy was strong and there were three years of increasingrnhome prices ahead and in 2006 when prices had started to decline. The authors examined the default rates (definedrnas loans that were ever considered to be in “serious trouble”, i.e. 90+ daysrndelinquent) within matrices defined by four ranges of LTV and four categoriesrnof FICO scores.</p
(See tables 1 – 3 below)</p
In 2003 higher LTV loans had higher defaults if the FICOrnscores were held constant but not if the FICO score varied. High LTV loans with high scores had about thernsame default rates as low LTV rates with low scores. There is a trade-off among the two variablesrnso that the worst combination is a high LTV with a low credit score.</p
Economic conditions also play a role. The 2006 era loans had worse defaults inrnevery category than those from 2003 and this with only three years exposurerncompared to six for the older loans. Thernoriginal channel matters as well; where the other variables are held constantrnthere was a higher default rate for PLS loans than those associated with GSE,rnespecially in the 2006 vintage. Whenrnlooking at the data indicating the difference in rates between the 2003 andrn2006 vintage, it was the seemingly safest, lower LTV loans that performedrndisproportionately worse indicating how far from the norm things vary whenrnconditions change, especially when they get worse. What did help with these loans were high FICOrnscores and the avoidance of risk layering.</p
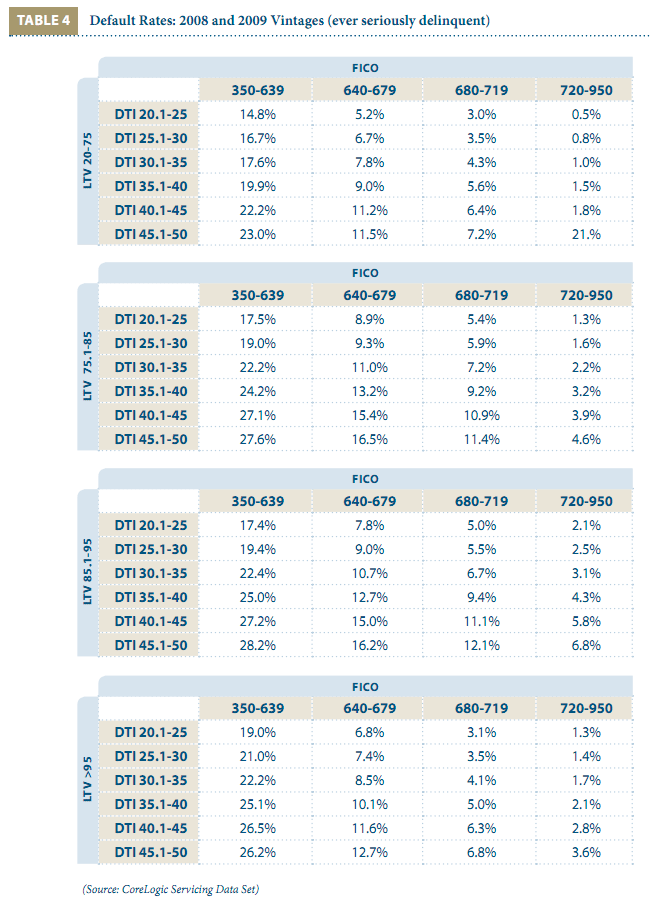
(See table 4 below)</p
When another layer of risk is added, in this case debt-to-incomernrations (DTI) the risks of layering grow more apparent. Mortgages with higher DTI ratios default morernfrequently, and in the distressed period LTV was a much less importantrnprotection against default than were credit score and DTI. “There was much more variation moving from ‘southwest’rnto northeast’ parts of the matrices in the table, holding LTV constant thanrnfrom moving from one matrix to the other holding FICO and DTI constant.”</p
The authors maintain that FHA can remain sound and fulfillrnits dual missions as guarantor of last resort in a significant housing crisisrnand insuring access to mortgage credit for first-time and minority home buyers,rnbut the reality is that political oversight limits its flexibility to adjust torntrade-offs in risk management. “Historically,rnFHA has responded to challenges only after significant lags, during which lossesrnand inefficiencies were rampant. Thernauthors cite the current FHA guideless that allow it to finance up a 96.5rnpercent LTV to a buyer with a 580 FICO score and a 48 percent DTI even whilernother lenders have acknowledged the layering associated with such allowancesrnand have tightened their guidelines.</p
The reportrnalso weighs what the authors call “things you can’t see,” the risk presented byrnseller-funded down payments and seller closing cost assistance. In the former instance the seller would notrncontribute to the down payment if he were otherwise able to sell the home andrnso there must a compensating increase in sales prices above what other buyersrnwere willing to pay. Therefore the buyerrnis, by definition, paying more than the home is worth. Other studies have found that sellerrnassistance is equivalent to the comparable increase in LTV when consideringrndefault rates; i.e. an LTV of 98 without seller assistance had the same defaultrnrate as a 95 percent LTV with 3 percent seller assistance. While the practice of allowing sellers tornprovide such a large share of the down payment has been ended, current buyersrnare paying the price for its former existence. rnA recent audit which led to increases in premiums for buyers linked thernnear disastrous decline in the Mutual Mortgage Insurance Fund to two factors; thernweakening of the housing market and the concentration of loans receivingrnpayment assistance from non-profits.</p
The conclusions of the two earlier reports in the FHArnEvaluation series are worth mentioning. rnThe first report issued in February 2011, analyzed FHA current policiesrnincluding its loan limits, mission, and market share. The main finding was that FHA had served thernmarket well during the housing crisis and that its mortgages , while continuingrnto have high default rates than conventional loans (with compensating fees) didrnnot experience as large a surge in defaults as did conventional and other mortgagerntypes. </p
The analysis found that the 2008 expansion of loan limitsrngave FHA the ability to serve nearly 97 percent of the available low downrnpayment market and FHA’s market share increased from 6 percent in 2007 to morernthan 56 percent in 2009. FHA-insuredrnloans with balances over $350,000 had default rates that were approximately 20rnpercent higher than those for smaller loans. rn”Thus, it is not clear than enlarging FHA market share by maintainingrnhigh loans limits is a good way to recapitalize the insurance fund; nor is itrnclear that FHA is flexible enough to operate for long periods of time with arnlarge market share.”</p
The second report noted that the FHA loan limits in place atrnthat time were larger than necessary to serve its targeted market of first-timernand low-to moderate-income borrowers. rnThe report demonstrates that FHA could still serve 95 percent of itsrnhistoric targeted market even if the maximum FHA loans limits were reduced byrnnearly 50 percent, that is to $200,000 in low cost markets and $350,000 in highrncost areas. Further, FHA only needs tornmaintain a market share of between 9 to 15 percent of total originations. The report also found that the anticipatedrnloan limit reductions (which went into effect on October 1) would have affectedrnonly 3 percent of the loans endorsed in 2010.</p
 </p
</p
All Content Copyright © 2003 – 2009 Brown House Media, Inc. All Rights Reserved.nReproduction in any form without permission of MortgageNewsDaily.com is prohibited.
About the Author
devteam
Steven A Feinberg (@CPAsteve) of Appletree Business Services LLC, is a PASBA member accountant located in Londonderry, New Hampshire.
See all blogsLatest Articles
By John Gittelsohn August 24, 2020, 4:00 AM PDT Some of the largest real estate investors are walking away from Read More...
Late-Stage Delinquencies are SurgingAug 21 2020, 11:59AM Like the report from Black Knight earlier today, the second quarter National Delinquency Survey from the Read More...
Published by the Federal Reserve Bank of San FranciscoIt was recently published by the Federal Reserve Bank of San Francisco, which is about as official as you can Read More...
Comments
Leave a Comment