
Blog

FHFA: Home Prices Down Again in Second Quarter
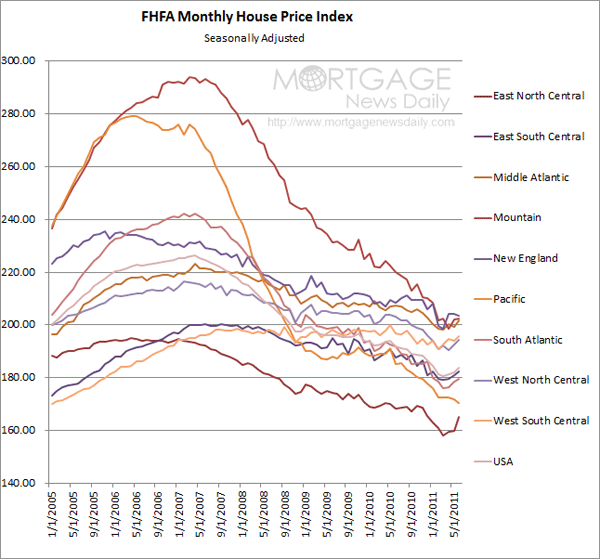
The Federal Housing Finance Agency (FHFA)rnhas released its seasonally adjusted purchase-only house price index (HPI) forrnthe second quarter of 2011 and for the fourth consecutive quarter it reportsrnthat those prices declined nationwide. rnThe HPI measures prices recorded for repeat home sales using Freddie Macrnor Fannie Mae mortgages. During thernperiod which ended June 30 there was a deterioration of national home prices ofrn0.62 percent. During June, the lastrnmonth in the current reporting period, however the HPI did rise 0.9rnpercent. Over the last four reportingrnperiods the HPI has dropped 5.9 percent and, at the end of June was down 18.8rnpercent from the price peak reached in April 2007. A second index, the all-transactions HPIrnwhich includes refinancing as well as purchases, decreased 1.9 percent in thernsecond quarter and is down 4.5 percent over the last year. </p
The four-quarter decline in home pricesrnover the last four quarters stands in contrast to the prices of other goods andrnservices which rose 4.5 percent during the same period resulting in anrninflation-adjusted change in the price of purchased homes of -10 percent in onernyear.</p
The seasonally adjusted purchase-onlyrnHPI declined from the first quarter to the second quarter in 31 states and,rnover the last year, only three states have recorded any home pricernappreciation, Oklahoma (+0.28 percent), North Dakota (+3.87 percent) and thernDistrict of Columbia (+12.23 percent.) rnThe largest price decrease over the last year was reported in Arizonarn(-14.91). Idaho, Georgia, Nevada, andrnOregon all had one year negative price changes in the 13 to 14 percent range</p
Of the nine census divisions, the NewrnEngland and West South Central divisions experienced the strongest price gainsrnin the latest quarter, with both posting 0.7 percent price increases. Pricesrnwere weakest in the Mountain census division, where prices fell 2.3 percent.</p
The HPI tracks average housernprice changes in repeat sales or refinancing of the same single familyrnproperties. The purchase only indexrncovers more than 6 million repeat sales transactions while the all-transactionrnindex covers 43 million repeat transactions.</p
All Content Copyright © 2003 – 2009 Brown House Media, Inc. All Rights Reserved.nReproduction in any form without permission of MortgageNewsDaily.com is prohibited.
About the Author
devteam
Steven A Feinberg (@CPAsteve) of Appletree Business Services LLC, is a PASBA member accountant located in Londonderry, New Hampshire.
See all blogsLatest Articles
By John Gittelsohn August 24, 2020, 4:00 AM PDT Some of the largest real estate investors are walking away from Read More...
Late-Stage Delinquencies are SurgingAug 21 2020, 11:59AM Like the report from Black Knight earlier today, the second quarter National Delinquency Survey from the Read More...
Published by the Federal Reserve Bank of San FranciscoIt was recently published by the Federal Reserve Bank of San Francisco, which is about as official as you can Read More...
Comments
Leave a Comment