Blog

First Broad-Based Decline in Home Price Growth Since Feb 2008
The S&P Dow Jones Case-Shiller Home Price Indices for June confirmrnwhat reports from earlier months have indicated, that there is a sustainedrnslowdown in home price increases. Junerndata indicate that the slowdown is also nationwide, affecting every one of thern20 cities tracked.</p
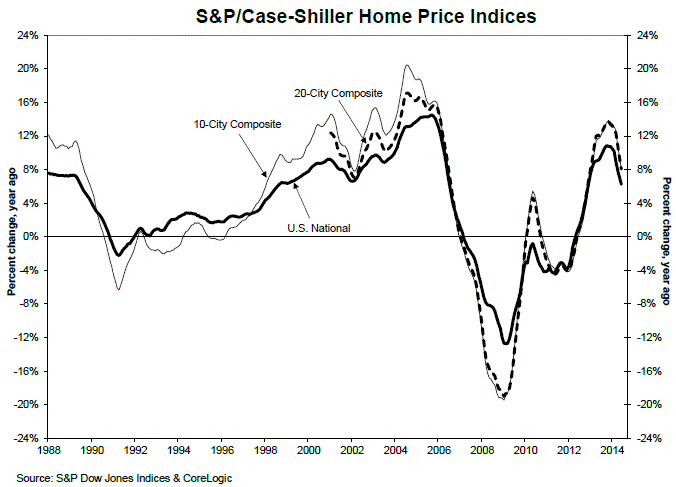
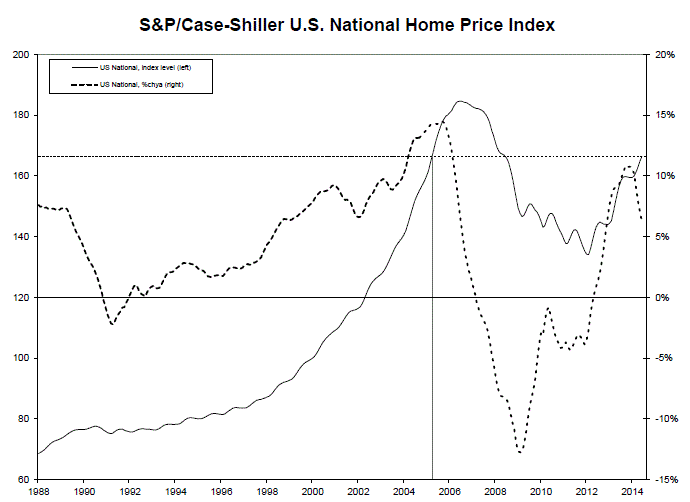
The National Index, which has been reported quarterly but will now bernpublished monthly, gained 6.2 percent in the 12 months that ended in June. Both the 10-City and the 20-City CompositernIndices were up 8.1 percent on a year over year basis, but all three measuresrnwere considerably lower than in May and every city saw its rate of pricernincrease worsen on an annual basis.</p
The National Index was up 0.9 percent in June; it had increased by 1.1rnpercent from April to May. The twenty cityrncomposites each increased by 1.0 percent compared to 1.1 percent for thern10-City and 1.2 percent for the 20-City the previous month. </p
 </p
</p
“Home price gains continuernto ease as they have since last fall,” DavidrnM. Blitzer,rnChairman of the Index Committee at S&P Dow Jones Indices said. “For the first time sincernFebruary 2008, all cities showedrnlower annual rates thanrnthe previous month.rnOther housing indicators – starts,rnexisting home salesrnand builders’ sentimentrn- are positive. Taken together,rnthese point to a more normal housing sector.”</p
All 20rncities saw their year-over-year rates weakenrnin June. For the second consecutive month,rnSanrnFrancisco saw itsrnrate decelerate by almost three percentage points -rnfrom 18.4 percent in April to 12.9rnpercent in June.rnPhoenix showed its smallestrnyear-over-year gainrnsince March 2012, 6.9rnpercent. Clevelandrnshowed a marginal increase of 0.8 percent over the last 12 months while LasrnVegas led with a gainrnof 15.2rnpercent.</p
Monthly price gains remain strong withrnall 20 cities reporting a third consecutive month of price increases and for 19 of them (New York being the exceptionrndue to a slight dip in March) the fourth in a row. Five cities -rnDetroit, Las Vegas, New York, Phoenix and San Diego – posted larger gains in June than in May. Dallas and Denver continue to set new price peaks while Detroitrnremains the only city below itsrnJanuary 2000 value. </p
New York had the strongest monthly increase at 1.6 percent, the largestrnsince June 2013. Chicago, Detroit, andrnLas Vegas all posted increases of 1.4 percent; for Las Vegas this was thernlargest monthly gain since last summer. It was the eighth consecutive increase for San Francisco but at 0.3 percent the smallest sincernFebruary. </p
“The monthly National Index rose 0.9 percent in June,” Blitzer said. “Whilernall 20 cities sawrnhigher home prices over the last 12 months,rnallrnexperienced slower gains.rnIn SanrnFrancisco, the pace of price increasesrnhalved since late last summer. The SunrnBelt cities – Las Vegas,rnPhoenix, Miami and Tamparn- all remain a thirdrnorrnmore below their peak pricesrnsetrnalmost a decade ago.”</p
 </p
</p
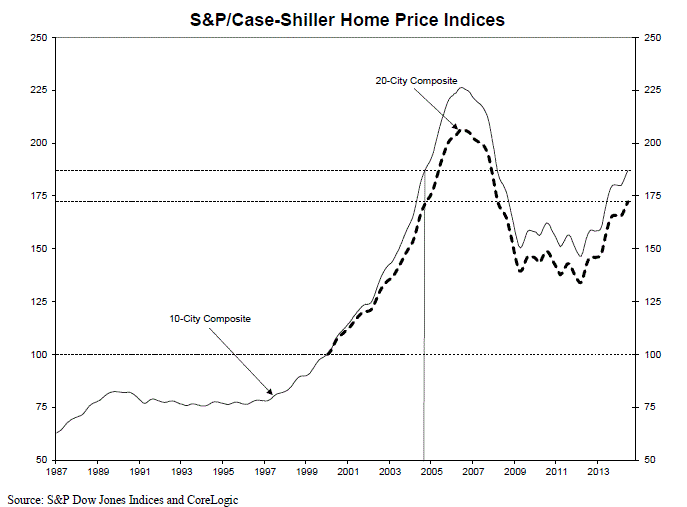
Prices as of Junernon the National Index are back to the levels they experienced in the spring ofrn2005. The 10- and 20-City Indices showrnaverage home prices back to the fall 2004 levels. Measured from their June/July 2006 peaks, the peak-to-current decline for both Composites is approximately 17 percent. The recovery from the March 2012 lows is 27.8 and 28.5 percent for the 10-City and 20-CityrnComposites.</p
 </p
</p
Blitzer said, “Bargain basement mortgagernrates won’t continue forever; recent improvements in the labor markets and commentsrnfrom Fed chair Janet Yellen and others hint that interest rates could rise as soon as the firstrnquarter of 2015. Rising mortgage rates won’t send housingrninto a tailspin, but will furtherrndampen price gains.”</p
The S&P/Case-Shiller Home Price Indices are constructed to track the price path of typical single-family homes located in each metropolitan area provided. Each index combinesrnmatched price pairs for thousandsrnof individual houses from the availablernuniverse of arms-length sales data. The S&P/Case-Shiller National U.S. Home Price Index tracks the value of single-family housing within the United States. The index is a composite of single-family home price indicesrnfor the nine U.S. Census divisions. The S&P/Case-Shiller 10- and 20-City Composites are value- weightedrnaverages of relevant metro area indices.rnThe indices have a base value of 100 in Januaryrn2000; thus, for example,rna current index value of 150 translates to a 50 percent appreciation rate sincernJanuary 2000 for a typical home locatedrnwithin the subject market.</p<p
All Content Copyright © 2003 – 2009 Brown House Media, Inc. All Rights Reserved.nReproduction in any form without permission of MortgageNewsDaily.com is prohibited.
Latest Articles
By John Gittelsohn August 24, 2020, 4:00 AM PDT Some of the largest real estate investors are walking away from Read More...
Late-Stage Delinquencies are SurgingAug 21 2020, 11:59AM Like the report from Black Knight earlier today, the second quarter National Delinquency Survey from the Read More...
Published by the Federal Reserve Bank of San FranciscoIt was recently published by the Federal Reserve Bank of San Francisco, which is about as official as you can Read More...

Comments
Leave a Comment