
Blog

Foreclosure Inventories Climb Even as Delinquencies Recede
Mortgagerndelinquencies continued to decline in October according to information releasedrntoday by Lender Processing Services. Atrnthe same time foreclosure inventories reached a record high during the month,rnnow representing 4.29 percent of all active mortgages.</p
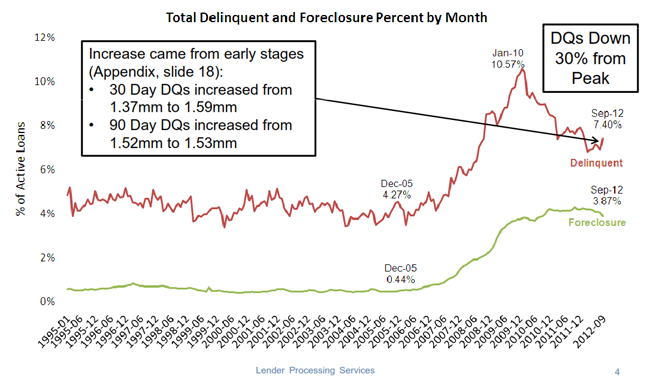
The totalrndelinquency rate in the country is now 7.93 percent down from 8.09 percent inrnSeptember and 9.29 percent in October 2010. rnThe delinquency rate is now 30 percent below the peak reached in Januaryrn2010. However, as the average days of delinquencyrnhave steadily increased, so has the foreclosure inventory, i.e. thosernproperties that will in all probability become owned real estate (REO) at somernpoint. The pre-foreclosure inventory nowrnstands at a rate of 4.29 percent, up from 4.18 percent in September and 3.92rnpercent a year earlier. </p
The average delinquentrnloan in foreclosure has been delinquent for 631days. At the beginning of the foreclosure crisis anrnaverage foreclosure took 251 days from the first missed payment. The length of the process has increased byrnthree months just since the beginning of this year. The average days that a loan is seriously delinquentrn(90+ days) before the foreclosure process is implemented, however, declined forrnthe second straight month in October and is now 388 days. </p
 </p
</p
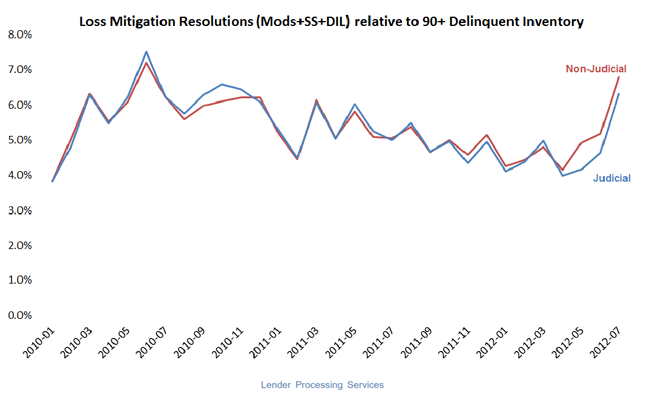
There were overrn200,000 foreclosure starts in October with about 42 percent of them beingrnrepeat starts, as persons who were previously in foreclosure and cured or werernable to modify their loans fell into trouble again. Repeat starts have increased about tenrnpercentage points in the last three months.</p
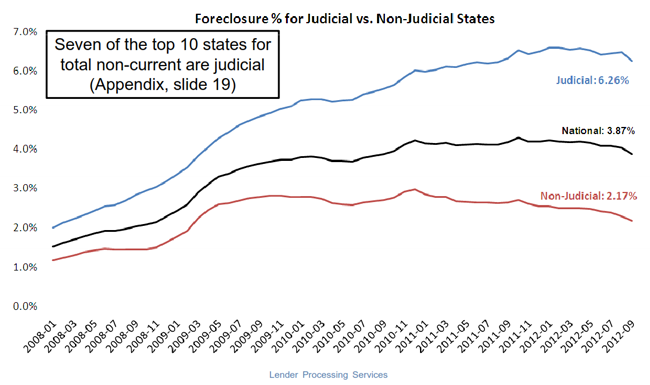
Judicial vs. non-judicial foreclosurernprocesses remain a significant factor in the reduction of foreclosure pipelinesrnfrom state to state, with non-judicial foreclosure inventory percentages lessrnthan half that of judicial states. This is largely a result of the fact thatrnforeclosure sale rates in non-judicial states have been proceeding at four tornfive times that of judicial. Non-judicial foreclosure states made up thernentirety of the top 10 states with the largest year-over-year decline inrnnon-current loans percentages.</p
The states with the highest percentagernof non-current loans are Florida, Mississippi, Nevada, New Jersey, andrnIllinois. </p
FHA loans originated in the period 2008rnto 2009 are defaulting at record rates. rnNearly $25,000 million in loans from that vintage have missed more thanrn15 payments and another $18,000 million have missed 12. </p
 </p
</p
<br /The October data also showed that mortgage originations are on the rise,rnreaching levels not seen since mid-2010. Mortgage prepayment rates have alsornspiked, as much of the new origination is related to borrower refinancing;rnloans originated in 2009 and later are the primary drivers of the increase. Asrnthey have since the beginning of the housing crisis, the GSEs and FHA continuernto represent the majority of the market, now a total of 87 Percent as of thernend of Q2. </p
All Content Copyright © 2003 – 2009 Brown House Media, Inc. All Rights Reserved.nReproduction in any form without permission of MortgageNewsDaily.com is prohibited.
About the Author
devteam
Steven A Feinberg (@CPAsteve) of Appletree Business Services LLC, is a PASBA member accountant located in Londonderry, New Hampshire.
See all blogsLatest Articles
By John Gittelsohn August 24, 2020, 4:00 AM PDT Some of the largest real estate investors are walking away from Read More...
Late-Stage Delinquencies are SurgingAug 21 2020, 11:59AM Like the report from Black Knight earlier today, the second quarter National Delinquency Survey from the Read More...
Published by the Federal Reserve Bank of San FranciscoIt was recently published by the Federal Reserve Bank of San Francisco, which is about as official as you can Read More...
Comments
Leave a Comment