
Blog

Foreclosures have Doubled in Some States Despite Overall Decline
RealtyTrac reported today that anrnuptick in foreclosure starts last month drove an overall increase in the nation’srnforeclosure activity. There was a 7rnpercent jump in the filings of initial public notice – Notice of Default (NOD)rnor Lis Pendens (LIS), part of a total of 117,485 foreclosure related filingsrnduring the month. March filings, whichrnalso included Notice of Scheduled Auctions and Bank Repossessions (REO) were uprn4 percent from February but were 23 percent lower than in March 2013. Scheduled Auctions were also up, rising 6rnpercent from the previous month. </p
There were 28,840 bank repossessions</bin March, down 5 percent from February and 34 percent from a year earlier. It was the lowest number of repossessions sincernJuly 2007, an 80 month low.</p
RealtyTrac said that March was thern42nd month in which foreclosure activity was lower than during thernsame period a year before and foreclosure activity in the first quarter was thernlowest since the second quarter of 2007. rnIn the first quarter there were 341,670 properties nationwide thatrnreceived some type of foreclosure notice, down 3 percent from the fourthrnquarter of 2013 and 23 percent below one year earlier. Foreclosure notices were filed on one inrnevery 385 U.S. housing units during the quarter. </p
Despite the continuous easing of thernforeclosure crisis there were 29 states in which scheduled auctions were up onrnan annual basis. Utah posted a 226rnpercent increase; Oregon 177 percent, and Connecticut 131 percent. Several of the states with double-digitrnincreases were those that have had perpetually elevated foreclosure activityrnsuch as New Jersey, New York, Nevada, and Florida.</p
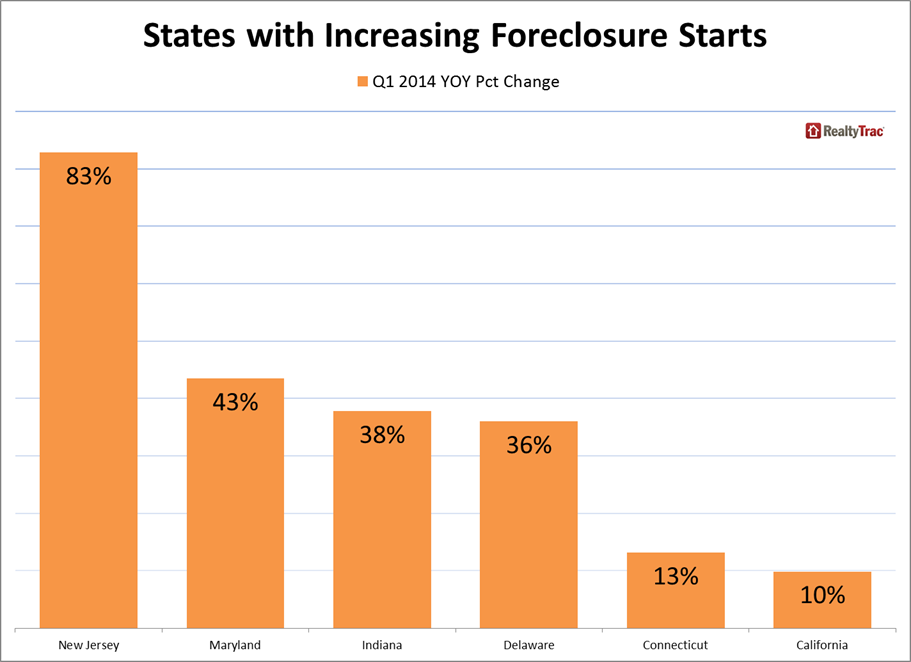
Along with the national increasernforeclosure starts were up 19 states. rnNew Jersey posted the largest change; starts there were up 83 percent,rnfollowed by Maryland, up 43 percent, Indiana, 38 percent, and Delaware 24rnpercent. A 10 percent increase inrnCalifornia was the first annual increase since the second quarter of 2012, andrnthe first double-digit percentage increase since the fourth quarter of 2009.</p
 </p
</p
“Now that the foreclosure deluge hasrndried up, banks are turning their attention back to properties that have beenrnsitting in foreclosure limbo for some time,” said Daren Blomquist, vicernpresident at RealtyTrac. “This is most evident in judicial foreclosure states</bthat were more likely to have impediments in the foreclosure process, but therernare also signs of this catch-up trend happening in some non-judicial statesrnlike California, where an increasing number of judicial foreclosure filingsrnboosted foreclosure starts in the first quarter.</p
“Banks will also now be able torndevote more resources to dealing with the lingering inventory of nearly half arnmillion already-foreclosed homes that still need to be sold,” Blomquistrncontinued. “Our estimates indicate only 10 percent of these bank-ownedrnproperties are listed for sale and more than half are still occupied by thernformer homeowner or tenant.”</p
RealtyTrac’s March and First QuarterrnU.S.rnForeclosure Market Report featured other data highlights:</p<ul class="unIndentedList"<liTherernwere 259,783 bank-owned properties withrnowner-occupancy data available in the first quarter – out of a total of 483,224rnbank-owned homes nationwide. RealtyTracrnsaid that 51 percent were still occupied by the former homeowner or a tenant. </li</ul
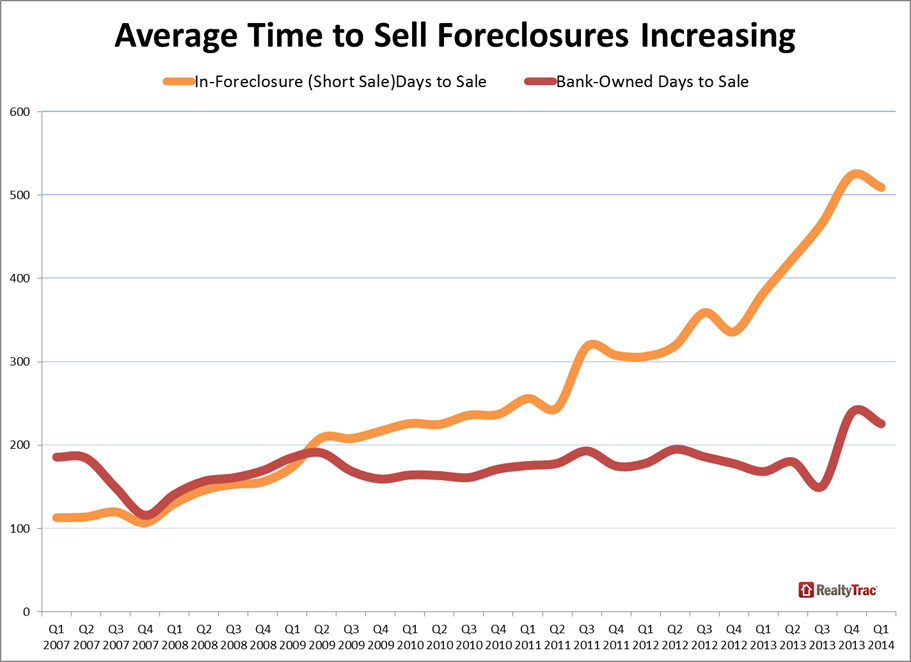
Average days to foreclose</p<ul class="unIndentedList"<liU.S. properties foreclosed in thernfirst quarter of 2014 were in the foreclosure process an average of 572 days,rnup 1 percent from 564 days in the previous quarter and up 20 percent from 477rndays in first quarter of 2013. NewrnJersey overtook New York with the longest average time to foreclose in thernfirst quarter, 1,103 days. That was followed by New York (986 days), Floridarn(935 days), Hawaii (840 days), and Illinois (830 days). In contrast it took 151 days to foreclose inrnAlaska, 169 in Texas, and 177 days in Delaware.rnNew Hampshire and Alabama also took an average of slightly less than 200rndays.</li</ul<ul class="unIndentedList"<liU.S. bank-owned properties sold inrnthe first quarter had been bank-owned for an average of 226 days when theyrnsold, up 34 percent from the average of 168 days in the first quarter of 2013.</li</ul<ul class="unIndentedList"<liProperties in the foreclosurernprocess that sold during the first quarter took an average of 509 days to sellrnafter starting the foreclosure process, up 33 percent from an average of 382rndays in the first quarter of 2013.</li</ul
 </p
</p
Even though its rate was down 1rnpercent from the previous quarter, has decreased annually for three consecutivernquarters and is down 19 percent from a year ago, Florida had the highest levelrnof foreclosure activity in the first quarter. rnOne in every 129 housing units in the state received a filing during thernperiod. </p
Florida was followed by Marylandrnwith one in every 189 housing units receiving a foreclosure filing, a onernpercent decrease from the fourth quarter but 35 percent above the level a yearrnearlier. Nevada was third with its foreclosurernrate, one in every 129 housing units. rnNevada’s filings decreased 8 percent in the first quarter and was downrn48 percent from the first quarter of 2013. rnIllinois with one in 230 units involved had the fourth highest rate andrnNew Jersey, one in 273, was fifth.
All Content Copyright © 2003 – 2009 Brown House Media, Inc. All Rights Reserved.nReproduction in any form without permission of MortgageNewsDaily.com is prohibited.
About the Author
devteam
Steven A Feinberg (@CPAsteve) of Appletree Business Services LLC, is a PASBA member accountant located in Londonderry, New Hampshire.
See all blogsLatest Articles
By John Gittelsohn August 24, 2020, 4:00 AM PDT Some of the largest real estate investors are walking away from Read More...
Late-Stage Delinquencies are SurgingAug 21 2020, 11:59AM Like the report from Black Knight earlier today, the second quarter National Delinquency Survey from the Read More...
Published by the Federal Reserve Bank of San FranciscoIt was recently published by the Federal Reserve Bank of San Francisco, which is about as official as you can Read More...
Comments
Leave a Comment