
Blog

Higher Home Prices Suggest Foreclosure Over Short-Sales
Rising home prices have been a boon to many homeowners but mayrnnot bode as well for those who are facing foreclosure. Black Knight Financial Services’ Mortgage Monitor this month takes a lookrnat how liquidation strategies for properties facing foreclosure can affect thernrecovery on principal made by lenders. rnThey found that foreclosure and sale of the resulting REO may provide a<bhigher recovery of the unpaid principal balance (UPB) than short sales, arnreversal from just a few years ago.</p
Using its newly developed Resolution Module the companyrnlooked at three methods of liquidation, a sale to a third party at foreclosurernauction which consistently results in a fully paid mortgage, short sales inrnwhich the lender agrees to take proceeds of the property sale which is, byrndefinition, less than the UPB, in full settlement of the debt, and arnforeclosure and subsequent sale of the REO.</p
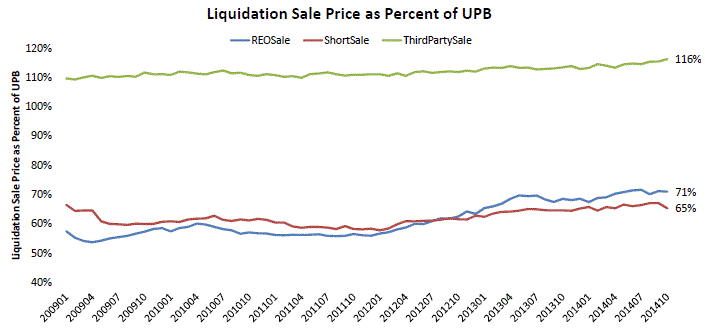
First Black Knight found that, beginning in October 2012, aboutrnsix months after home prices bottomed out, lenders began to recover a largerrnpercentage of UPB from foreclosure and resale than through a short sale. Recovery on an REO now averages 71 percent ofrnUPB while short sales recover from a REO 65 percent. </p
 </p
</p
Trey Barnes, Black Knight’s senior vicernpresident of Loan Data Products notes that, “Of course, REO sales havernadditional timelines and associated costs that impact total losses and are notrnaccounted for in this analysis. That said, on average, REO properties arernselling for 71 percent of the corresponding loans’ defaulted UPB, as comparedrnto just 65 percent for short sales. Both recovery rates pale in comparison tornthird-party sales at foreclosure auction, however, where average gross salesrnprice is 116 percent of UPB.”</p
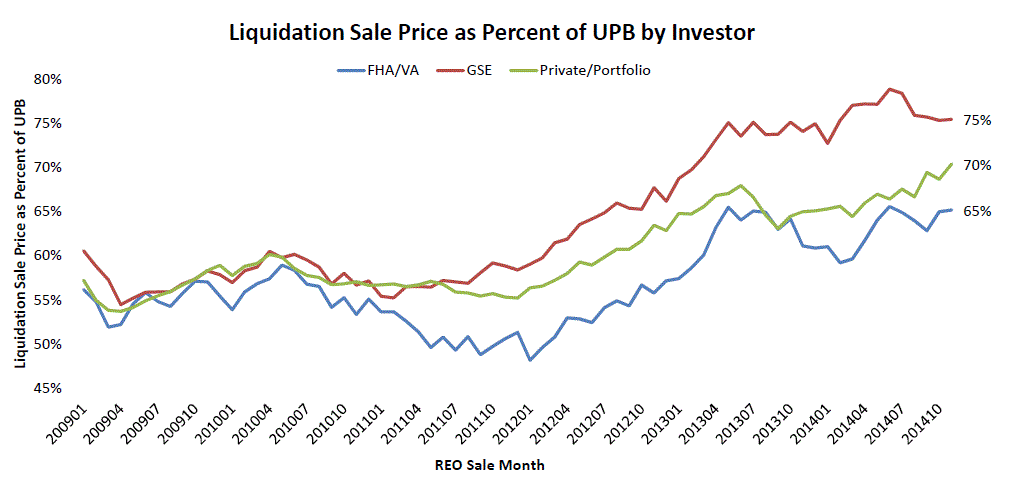
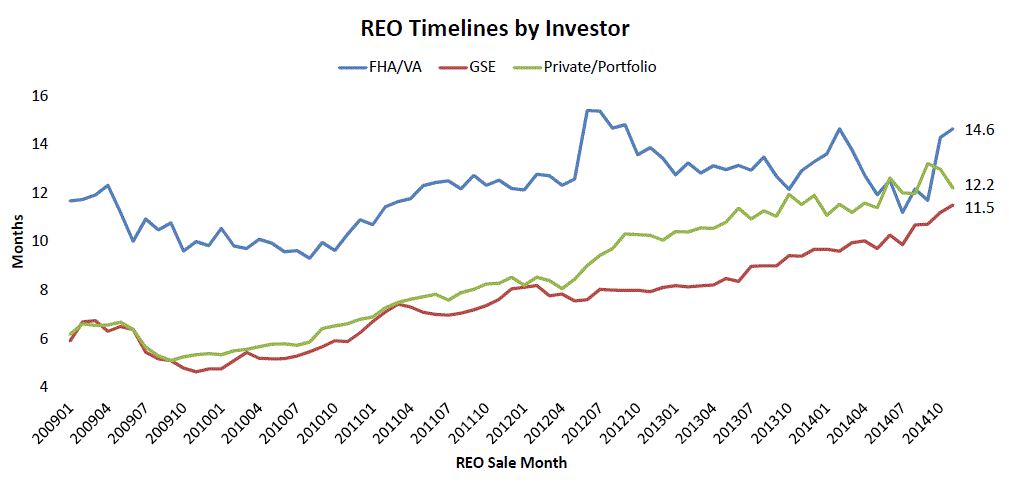
Barnes said, “We also saw clearrnseparation in terms of gross UPB recovery by investor groups. REO sales on GSErnloans gross a significantly higher percentage of UPB than do FHA andrnprivate/portfolio loans. GSE loans are currently averaging 75 percent gross UPBrnrecovery through REO, whereas FHA loans see just 65 percent. Portfolio and privaternloans land in the middle, with gross recovery of 70 percent of UPB. Inrnaddition, REO timelines on GSE loans are shorter than both FHA andrnprivate/portfolio, averaging just 11.5 months to complete liquidation. Givenrnthe additional carrying costs lenders face while holding REO properties, thernlonger timelines associated with FHA and private/portfolio loans can add up.”</p
 </p
</p
 </p
</p
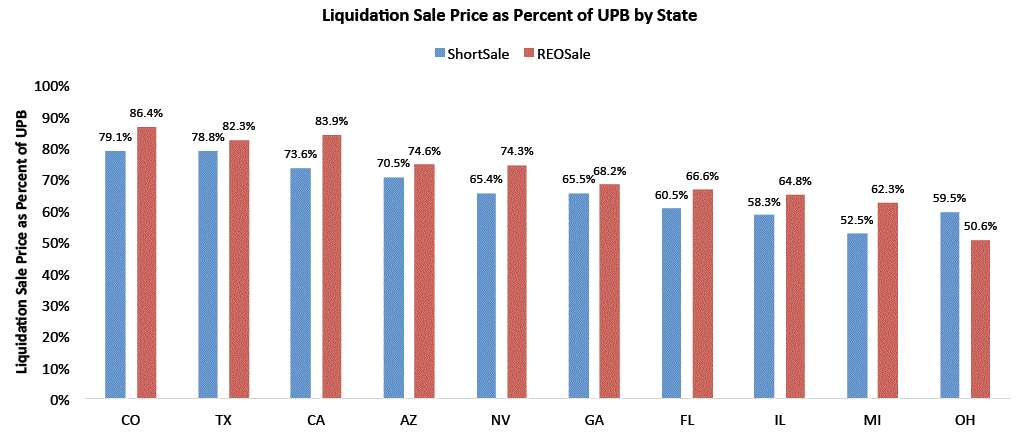
Black Knight looked at this data forrnthe states that have had the highest numbers of delinquent loans andrnforeclosures and found that, while recoveries as a percentage of UPB variedrnover a 30 percentage point range depending on location and recovery method, thernhigher recovery for REO sales held true almost universally. The exception was Ohio which also ranked nearrnor at the bottom for recoveries using either method. </p
 </p
</p
So, with short sales not the leastrnlikely to provide full recovery to the lender, will distressed homeowners nowrnhave no choice but to go through the lengthy foreclosure process? We have noted from other reported data that,rnwhile sales of distressed properties overall have steadily diminishing share ofrnhome sales, short sales generally rank below sales of REO. </p
BlackrnKnight also revisited, as it does regularly, monthly mortgage prepayment rates whichrnare tied closely to refinancing and found a 25 percent increase overrnNovember. This was the largest increase inrnprepayments since February 2009 and was 28.4 percent higher than in Decemberrn2013. The gain was particularlyrnpronounced among loans with credit scores over 720 which increased by 30rnpercent, newer loans, and those held in portfolio which went up by 40rnpercent. Most curious was the increasernof 38 percent among loans originated in 2014. rn</p
The Monitor’s monthly review ofrnperformance metrics noted a decline of 7.21 percent in the national delinquencyrnrate since November to 5.64 percent of all homes with a mortgage. The rate has dropped by 12.72 percent sincernDecember 2013. There were 2.87 millionrnloans that were 30 days or more past due but not yet in foreclosure in December,rndown 220,000 from November and 375,000 from one year earlier. Ofrnthose 1.13 million were seriously delinquent (90 days or more) but not yet inrnforeclosure, a decrease of 31,000 from November and 148,000 from a yearrnearlier. </p
The pre-sale inventory, the number ofrnmortgages for which foreclosures have commenced, fell by 9,000 from November torna total of 820,000, 1.61 percent of all mortgages. The inventory in December of 2013 numberedrnapproximately 1.24 million loans. </p
There were 89,400 foreclosure starts inrnDecember, an increase of 20.97 percent month over month but down 14.69 percentrncompared to one year earlier. </p
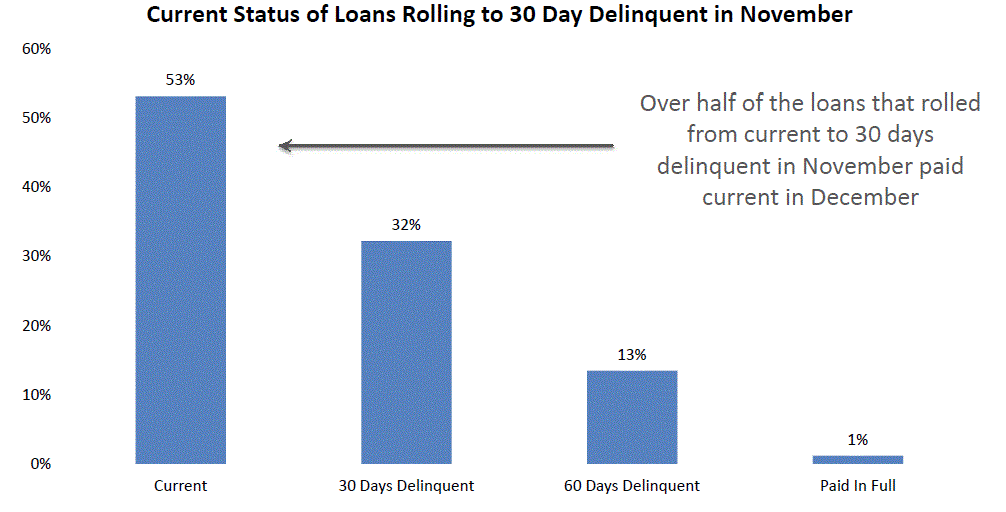
Black Knight found that 53 percent ofrnthe mortgages that become 30 days past due in November cured in December. An additional 32 percent remained at 30 daysrnwhile 13 percent rolled into the 60-day bucket. rnThis cure rate was about 5 percentage points higher than the average ofrnthe previous several months while the roll into greater delinquency was 2 to 4rnpoints lower. </p
 </p
</p
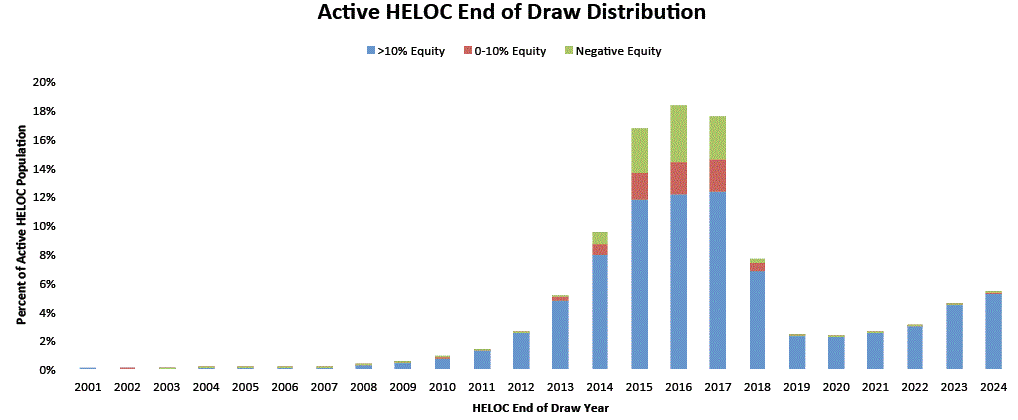
Finally the Monitor updated the situation with home equity lines of creditrn(HELOCs), a concern to lenders and regulators as large numbers approach theirrnend-of-draw (EOD) period and begin to amortize. rnThis will likely result in significant upticks in monthly payments. As the chart below shows, only 20 percent ofrnactive HELOCs have begun to amortize with by far the largest numbers of loansrnreaching that EOD period this year and the two years that follow. These loans are also those with the highest incidencernof negative equity which overall affects 17 percent of HELOCs.</p
 </p
</p
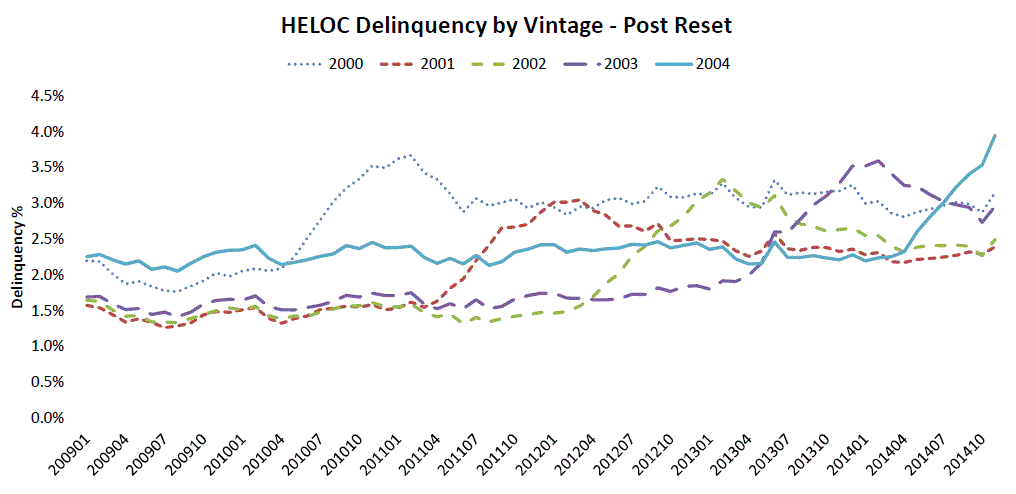
Historical data showsrna jump in delinquencies as each year’s vintage of HELOCs have reached EOD. Delinquency rates tend to level off somernmonths after the loans enter the amortization period, however they do remain elevated.rn The 2004 vintage, most of which reachedrnEOD last year, has higher rates of delinquency compared to earlier years,rnhowever that vintage of loan generally has higher delinquency rates at the 10rnyear mark.</p
All Content Copyright © 2003 – 2009 Brown House Media, Inc. All Rights Reserved.nReproduction in any form without permission of MortgageNewsDaily.com is prohibited.
About the Author
devteam
Steven A Feinberg (@CPAsteve) of Appletree Business Services LLC, is a PASBA member accountant located in Londonderry, New Hampshire.
See all blogsLatest Articles
By John Gittelsohn August 24, 2020, 4:00 AM PDT Some of the largest real estate investors are walking away from Read More...
Late-Stage Delinquencies are SurgingAug 21 2020, 11:59AM Like the report from Black Knight earlier today, the second quarter National Delinquency Survey from the Read More...
Published by the Federal Reserve Bank of San FranciscoIt was recently published by the Federal Reserve Bank of San Francisco, which is about as official as you can Read More...
Comments
Leave a Comment