Blog

Home Price Growth Slowing but Still Bubbly in West
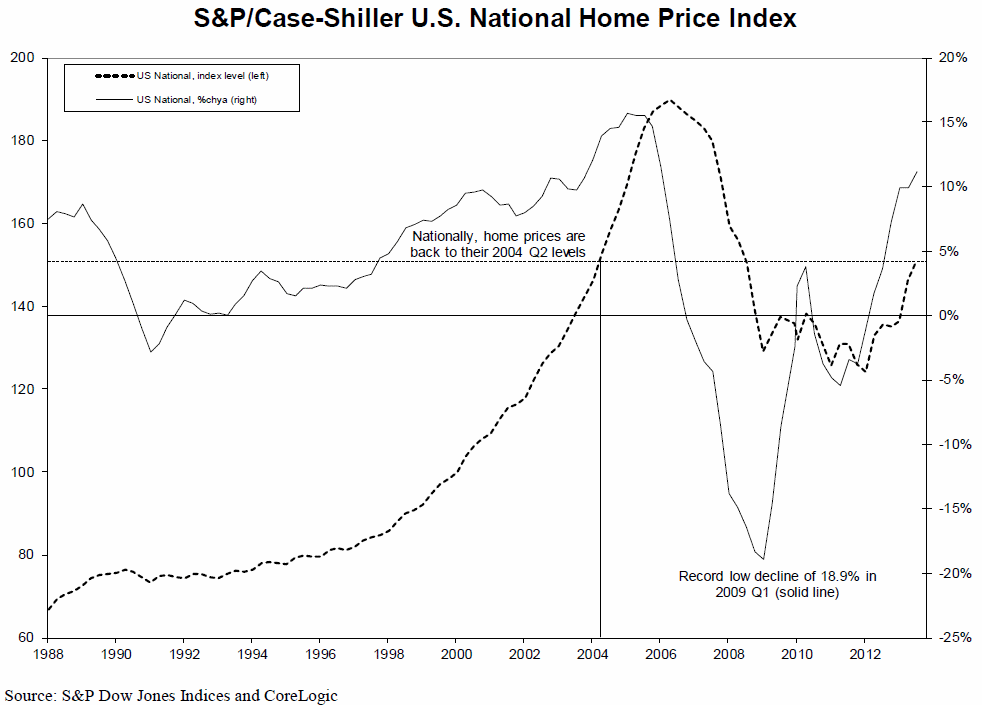
Homernprices continue to increase nationally, and the S&P Case-Shiller’s U.S.rnNational Home Price Index which is issued quarterly showed a strong thirdrnquarter where prices increased by 3.2 percent. rnThis bring price gains over the last four quarters to 11.2 percent.</p
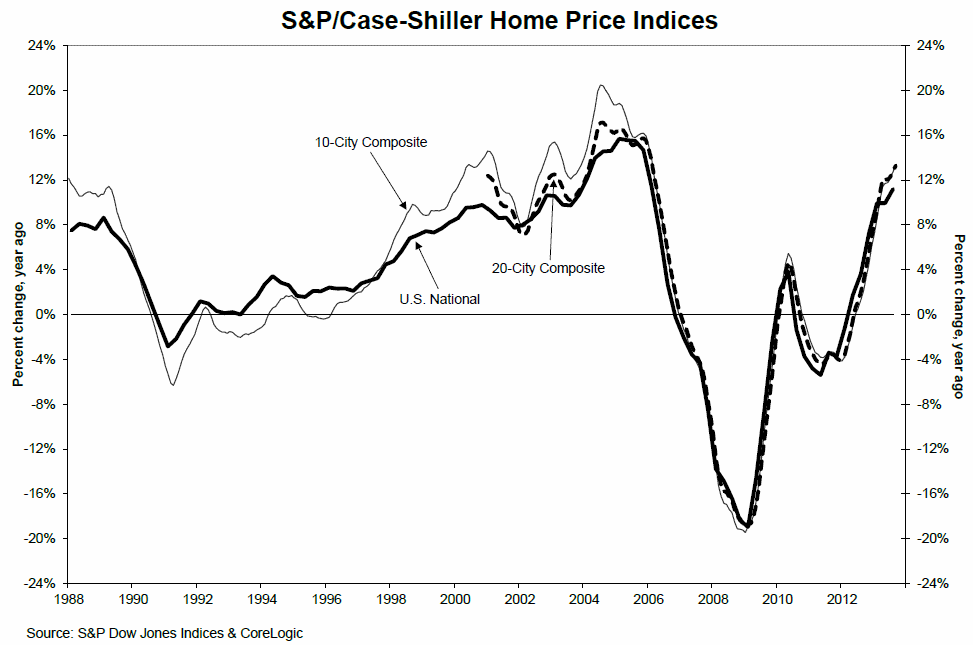
ThernCase-Shiller monthly indices for September, however, once again show that thernrate of price increases is slackening. Thern10-City and 20-City Composite Indices each gained 0.7 percent from August tornSeptember compared to 1.3 percent gains from July to August. The two measures each posted 13.3 percentrnincreases year-over-year. While 13 ofrnthe 20 cities tracked by the indices had higher annual growth rates, 19 hadrnsmaller increases in September than in August.</p
 </p
</p
“The second andrnthird quarters of 2013 were very good for home prices,” says David M. Blitzer,rnChairman of the Index Committee at S&P Dow Jones Indices.rn”The National Index is up 11.2% year- over-year, the strongestrnfigure since the boom peaked in 2006. The 10-City and 20-City Composites year-over-year growthrnatrn13.3% was their highestrnannual numbers sincernFebruary 2006.</p
“Housing continues to emerge from the financial crisis: the proportion of homes in foreclosure is decliningrnand consumers’ balancernsheets are strengthening. The longer runrnquestion is whether household formation continues to recover and if home ownershiprnwill return to thernpeak levels seen in 2004.”</p
As of the third quarterrnof 2013, average home prices across the United States are back to their levels posted in the second quarterrnof 2004. Measured from their June/July 2006 peaks, the peak-to-current decline for both Composites is approximately 20%. The recovery from the March 2012 lows is 22.9% and 23.6% for the 10-City and 20-City Composites.rnAt the end of the third quarterrnof 2013, the National Index wasrnup 3.2% over the second quarter of 2013 and 11.2% abovernthernthird quarter of 2012.</p
 </p
</p
Blitzer pointed tornespecially strong showings in the Western part of the country. Las Vegas had an annual price increase ofrn29.1 percent followed by San Francisco at 25.7 percent, Los Angeles at 21.8 percent and San Diego at 20.9rnpercent. These were the highest annual rates for San Franciscornand Los Angeles since Marchrn2001 and Decemberrn2005 respectively </p
Blitzer said thernstrong performance in the West is sparking questions and concernsrnabout the possibility of another bubble. “However the talk is focused on fear of a bubble, not a rush to join the party and buy. Moreover, other data suggest a market beginningrnto shift to slower growth rather than one about to accelerate. Existing home sales weakened in the most recentrnreport, home construction remains far below the boom levels of six or seven years ago and interest rates are expected to be higher a year from now.”</p
Other cities with double digitrnyear-over-year increases were Atlanta and Phoenix at 18.7 and 18.6 percent respectively;rnDetroit (17.2 percent), Tampa (14.5 percent) Miami (14.3 percent), Seattlern(13.2 percent), and Minneapolis (10.1 percent). rnChicago, while not in double digits, also made a strong showing with itsrnhighest year-over-year gainrnsince November 2005, 9.7rnpercent. </p
Among the 19rncities where the growth rate dropped from August to SeptemberrnLas Vegas which went from +2.9rnpercent in August to +1.3rnpercent in Septemberrnand Tampa, dropping from +1.8rnpercent to +0.2 percent. Charlotte was the only city to post a negativernmonthly return for September, its first since Novemberrn2012. </p
Thirteen cities improved their year-over-year returns from those in August. Cleveland accelerated the most (fromrn+3.7 percent in August to +5.0rnpercent in September), but it remains the second worst performing city with only New York trailing at +4.3 percent. </p
The S&P/Case-Shiller Home PricernIndices constructed to accurately track the price path of typicalrnsingle-family homes located in each metropolitan area provided. Each index combinesrnmatched price pairs for thousandsrnof individual houses from the available universe of arms-length sales data. The indicesrnhave a base value of 100 in Januaryrn2000; thus, for example, a current index value of 150 translates to a 50% appreciation rate since January 2000 for a typicalrnhome located within the subject market.rn
All Content Copyright © 2003 – 2009 Brown House Media, Inc. All Rights Reserved.nReproduction in any form without permission of MortgageNewsDaily.com is prohibited.
Latest Articles
By John Gittelsohn August 24, 2020, 4:00 AM PDT Some of the largest real estate investors are walking away from Read More...
Late-Stage Delinquencies are SurgingAug 21 2020, 11:59AM Like the report from Black Knight earlier today, the second quarter National Delinquency Survey from the Read More...
Published by the Federal Reserve Bank of San FranciscoIt was recently published by the Federal Reserve Bank of San Francisco, which is about as official as you can Read More...

Comments
Leave a Comment