Blog

Home Price Recovery Lags in Judicial Foreclosure States
The Federal Reserve Bank of New Yorkrnhas updated and released proceedings of a conference it held lastrnOctober in conjunction with the Rockefeller Institute of New York. The conference, entitled Distressed Residential Real Estate:rnDimensions, Impacts, and Remedies wasrndevoted to three main topics: </p<ul<li
Anrnassessment volumes of properties that remained in foreclosure and inrnthe real estate owned (REO) pipeline on a state, local, and nationalrnbasis. </i</p</li<li
Research onrnthe impact of foreclosures and distressed sales on home prices,rnownership rates, communities and families, and state and localrngovernment finances.</p</li<li
Policyrninitiatives intended to reduce the number of foreclosures and theirrnassociated impacts. </p</li</ul
At the conferencernnational and state level data as of June 2012 was provided byrnCoreLogic. Categories included the number of properties which werern90-plus days delinquent, in foreclosure, and in REO, as well as alternative projections of future REOrninventories based on the numberrnof days a loan stays in a ninety-plus day bucket and the average daysrnin foreclosure.</p
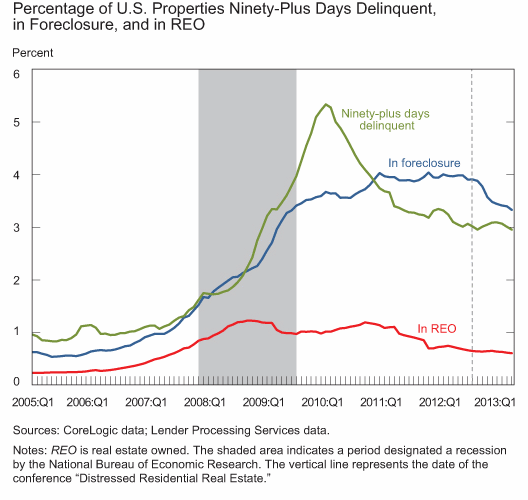
Thatrninformation, now updated to March 2013, shows just under 3 percent ofrnall mortgaged one-to-four-unit residential properties were ninety orrnmore days delinquent, essentially unchanged from June 2012. Thisrnis below the peak of about 5½ percent reached in late 2009 tornearly 2010, but well above the pre-crisis average of just underrn1 percent.</p
 </p
</p
In contrast, the percentage of loans inrnforeclosure, which had leveled off at around 4 percent fromrnearly 2011 through mid- 2012, declined to around 3½ percent byrnearly 2013 because, for the previous nine months more loans had movedrnout of foreclosure than moved in. Finally, the percentage ofrnproperties in REO continued to decline gradually over the period fromrnmid-2012 to early 2013.
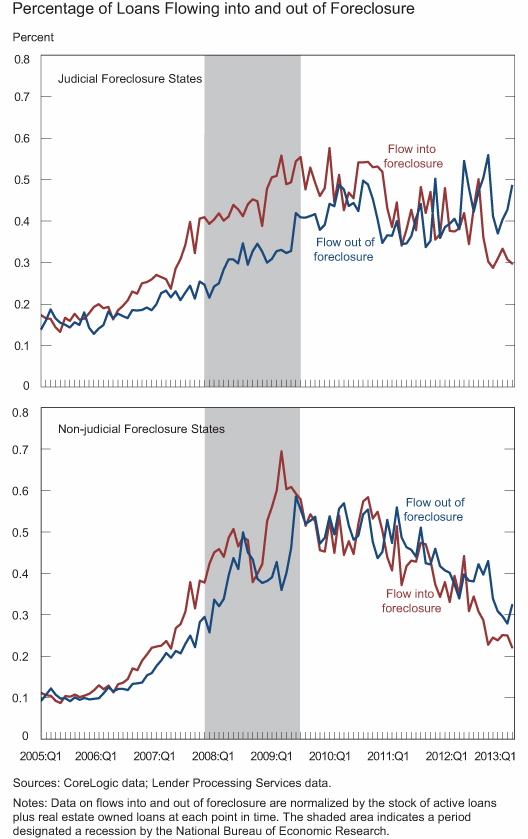
The conference looked at the largerndisparity in performance between states with a judicial foreclosurernprocess and those with a non-judicial process and noted that thernaverage number of days that a mortgage loan is ninety-plus daysrndelinquent at the time the foreclosure process is started is roughlyrncomparable in judicial and non-judicial states and that thernpercentage of loans flowing into foreclosure is also around the same.rnThe key distinction is in the rate of flow out of foreclosure or,rnalternatively, the average number of days a loan/property remains inrnthe foreclosure process. </p
 </p
</p
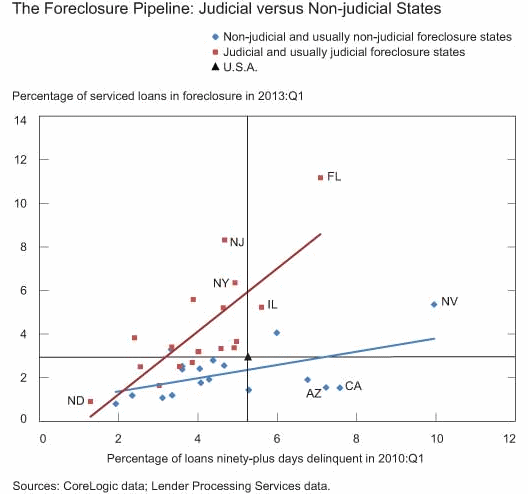
The difference between the judicial andrnnon-judicial states is seen more clearly in the following scatterrnplot. The horizontal axis measures a state’s ninety-plus-dayrndelinquency rate in the first quarter of 2010 when that rate peakedrnnationally. The vertical axis measures a state’s foreclosure raternin the first quarter of 2013. The blue diamonds representrnnon-judicial and usually non-judicial states while the red squaresrnrepresent the judicial and usually judicial states. The correspondingrnblue and red lines are least squares regression results for thernrespective sets of observations. For a given level of thernninety-plus-day delinquency rate in the first quarter of 2010, thernjudicial states have considerably higher foreclosure rates in earlyrn2013, indicating that the length of time a loan/property remains inrnthe foreclosure process in the judicial states is considerably longerrnthan in the non-judicial states. New York, New Jersey, andrnFlorida stand out as the most extreme examples of this phenomenon.</p

The considerablyrnlarger volume of loans in the foreclosure process in the judicialrnstates appears to be impeding home price recovery in those states. As can be seen in the chart below, for a given peak-to-trough declinernin home prices, the judicial foreclosure states have seen arnmeaningfully more modest improvement in home prices since the trough.rn(The exception is North Dakota, a small state with unusualrndemographics related to its current energy boom.) One potentialrnexplanation for this relationship is that potential homebuyers in thernjudicial states recognize that a large number of distressed salesrnhave yet to occur, and this consideration has influenced the pricesrnthey are willing to offer for homes currently on the market.</p
Conferencernparticipants concluded that non-judicial states are much furtherrnalong in reducing the backlog of loans in foreclosure and that havernprices have recovered more in the non-judicial states.
All Content Copyright © 2003 – 2009 Brown House Media, Inc. All Rights Reserved.nReproduction in any form without permission of MortgageNewsDaily.com is prohibited.
Latest Articles
By John Gittelsohn August 24, 2020, 4:00 AM PDT Some of the largest real estate investors are walking away from Read More...
Late-Stage Delinquencies are SurgingAug 21 2020, 11:59AM Like the report from Black Knight earlier today, the second quarter National Delinquency Survey from the Read More...
Published by the Federal Reserve Bank of San FranciscoIt was recently published by the Federal Reserve Bank of San Francisco, which is about as official as you can Read More...

Comments
Leave a Comment