
Blog

Home Prices Actually Undervalued Based on Incomes -CoreLogic
In an article that appeared recentlyrnin CoreLogic’s blog, Popping the HousingrnBubbly Theory, CoreLogic’s Chief Economist Dr. Mark Fleming presents a differentrntake on current home prices and whether recent gains are sustainable. Current thinking maintains that a housingrnbubble may already exist because home price appreciation has substantiallyrnoutpaced the rate that rents have grown. rnRenting and owning are generally considered to be “economicrnsubstitutes,” so Fleming says, “A significant difference in pricing should drawrnmore demand to the less expensive option, therefore driving up pricing andrnremoving the significant difference. This constant reversion to equilibriumrnbetween the two substitutes means any significant difference must be due tornirrational exuberance on the part of the homeowner or renter.”</p
But he argues for an alternativernview. Because most homeowners use theirrnincome to pay their mortgage it follows that an established relationship existsrnbetween income and home prices. Thisrnrelationship means that home price growth cannot be sustained at higher levelsrnthan income growth because housing would become unaffordable, demand wouldrndecline, bringing price growth back into alignment with income growth. </p
It is also important to note that thernsignificant variation in income levels across markets directly influencesrnhousing differences. “A million-dollarrnhome in San Francisco is very different from a million-dollar home in Columbus,rnOhio,” he points out.</p
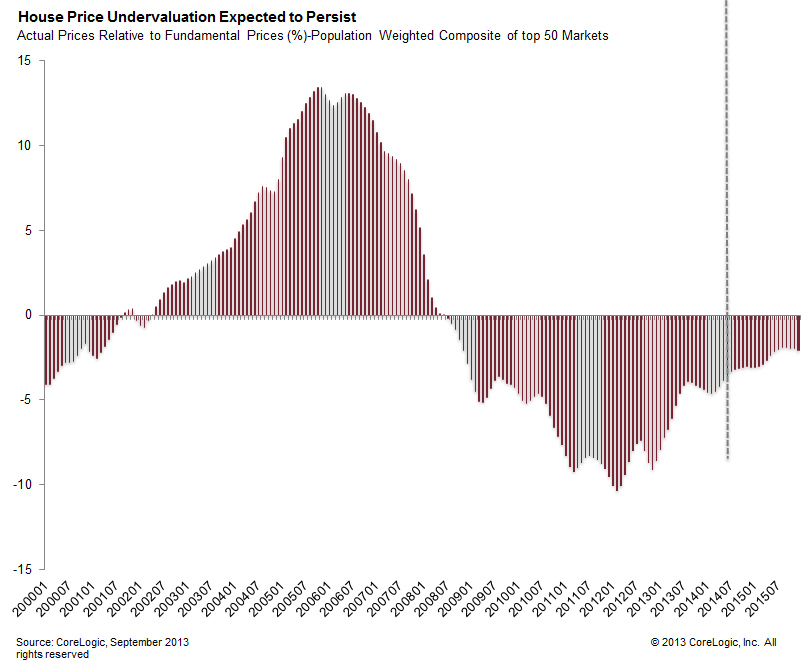
Fleming says CoreLogic uses this fundamental relationshiprnbetween house prices and income to forecast home prices. In each market there is a gap between thernhome price implied by the income level, i.e. the fundamental home price, andrnthe actual or forecasted house price. rnThis gap is measured as a percentage of the fundamental price. Byrnconstructing a composite measure of house prices relative to fundamental pricesrnit is possible to construct a population-weighted average of the largest 50rnmarket gaps over time. This allows us tornsee that house prices clearly got well ahead of what was fundamentallyrnsupported by income levels in the early 2000s and then there was a significantrnover correction. The figure below hasrnbeen updated and provides a home price forecast through the end of 2015.</p
 </p
</p
Fleming concludes that home prices,rndespite the double digit increases in the last two years, are actuallyrnundervalued relative to income and says that judging the bubbliness of pricesrncannot be done simply by comparing those prices to rents. “Doing so misses the point made earlier thatrnmuch of the recent house price appreciation is a result of market correctionrnfor the significant undervaluation caused by the price declines in the laternaughts. Instead, analyzing home price levels relative to fundamental pricesrnleads us to conclude that there is no need to fear a bubble for at least a fewrnyears to come, if at all.”rn</p
In a second blog piece titled Disproportionate Recovery in Housing’srnFreshman Year of Healing, Thomas Vitlo a Sr. Business Analyst in CoreLogic’srnOffice of the Chief Economist looks at the distribution of new home sales inrnthe market and geographically. New homernsales in the current market, he says, are well below what we would expect in arnmore stable market, making up an 8.9 percent share of home sales in Decemberrncompared to an average of 12.1 percent in 2000-2002. While new home sales are well below historicrnlevels they have been increasing their share over the last year, but the growthrnis not evenly distributed.</p
Looking at the nation’s census regions he finds that the southern states</b have some of the highest shares of new home sales while the northeastern state are not faring as well. Kentucky, Georgia, and Oklahoma have seen their new home share increase by 2.4, 2.0, and 1.6 percentage points respectively Connecticut fell 0.5 percentage points and New Jersey was down 0.5 points. Vitlo attributes this to the relatively inexpensive housing markets in the south while the three northern states have not had a significant new home rebound due to theirrn being high cost housing areas.</p
But he offers another explanation forrn the discrepancy. Connecticut and New Jersey, as well as Massachusetts where the percentage of new home sales was unchanged, are judicial foreclosure states. This means they have longer foreclosure timelines which have prevented inventories of bank-owned real estate (REO) from clearing quickly. There are similar problems with distressed propertiesrn in the Midwest with the exception of the booming energy state of North Dakota.</p
 </p
</p
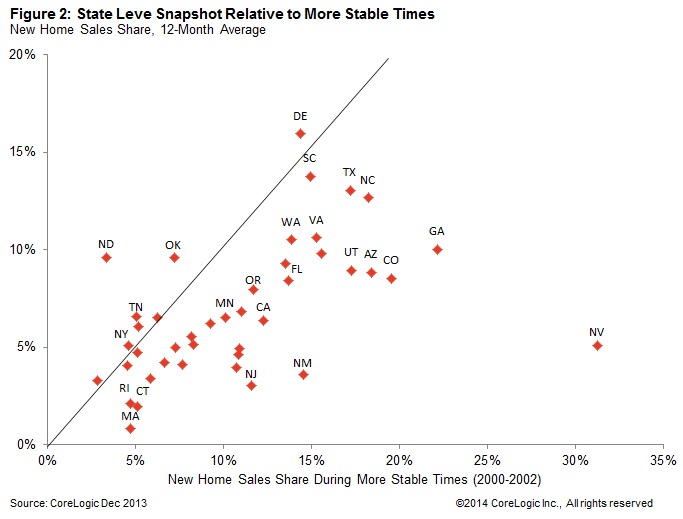
The second figure compares the monthlyrnaverage new home sales share in 2013 compared to more stable times fromrn2000-2002. States that are above thernline had higher new home sales shares in 2013 compared to 2000-2002 and can berndeemed as improving. As an example,rnNevada averaged a 31.2 percent new home sales share during the early 2000s,rnwhich was the highest share in the country, but in 2013 that share was only 5.1rnpercent, as limited supplies and distressed properties competed with the newrnhome sales market.
All Content Copyright © 2003 – 2009 Brown House Media, Inc. All Rights Reserved.nReproduction in any form without permission of MortgageNewsDaily.com is prohibited.
About the Author
devteam
Steven A Feinberg (@CPAsteve) of Appletree Business Services LLC, is a PASBA member accountant located in Londonderry, New Hampshire.
See all blogsLatest Articles
By John Gittelsohn August 24, 2020, 4:00 AM PDT Some of the largest real estate investors are walking away from Read More...
Late-Stage Delinquencies are SurgingAug 21 2020, 11:59AM Like the report from Black Knight earlier today, the second quarter National Delinquency Survey from the Read More...
Published by the Federal Reserve Bank of San FranciscoIt was recently published by the Federal Reserve Bank of San Francisco, which is about as official as you can Read More...
Comments
Leave a Comment