
Blog

Home Prices Increased Substantially in July, but Growth May be Slowing
Indices releasedrnby two of the leading sources of home price information this morning confirmrnthe continued growth of home values in the U.S., at least through July. While their methodologies differ and directrncomparison is not possible, both showed substantial growth for the month. The Federal Housing Finance Agency (FHFA)rnsaid its House Price Index (HPI) rose 1.0 percent on a seasonally adjustedrnbasis in July while S&P/Case-Shiller reported its 10-City Composite rosern1.9 percent and its 20-City Composite was up 1.8 percent. </p
However, whilernthe Case-Shiller Indices indicate that growth may be slowing, both its indicesrnrose 2.2 percent from May to June, the FHFA HPI showed month-over-monthrnappreciation at the highest level since March. rnCase-Shiller reports that all 20 cities tracked by its two indicesrnshowed monthly gains for the fourth consecutive month, but like the two composites,rn15 of the cities had smaller gains in July than in June. </p
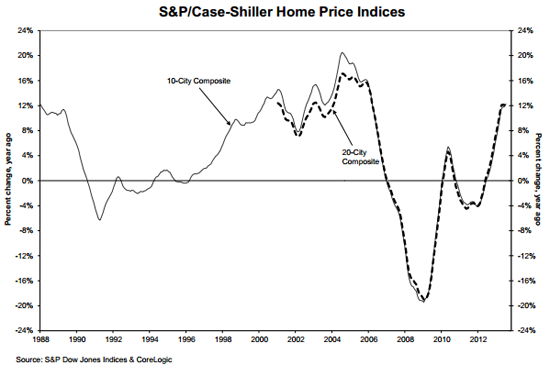
On an annualrnbasis the 10-City has gained 12.3 percent since July 2012 and the 20-City 12.4rnpercent and the deceleration in price gains was not as pronounced as in thernmonthly returns. Thirteen of the 20rncities had larger annual increases in July than in June. </p
 </p
</p
“Home prices gains are holding their 12% annual rate of gain established by the two Compositernindices in April,” says David M. Blitzer, Chairman of the Index Committee at S&PrnDow Jones Indices.rn”The Southwest continues to lead the housing recovery. Las Vegasrnhome prices are up 27.5 percent year-over-year; in California, San Francisco, Los Angeles and San Diego are up 24.8, 20.8, and 20.4 percent respectively. However, all remain far below their peak levels.</p
“Since April 2013, all 20 cities are up month to month; however, the monthly rates of price gains have declined.rnMore cities are experiencing slow gains each month than the previous month, suggesting that the rate of increasernmay have peaked.</p
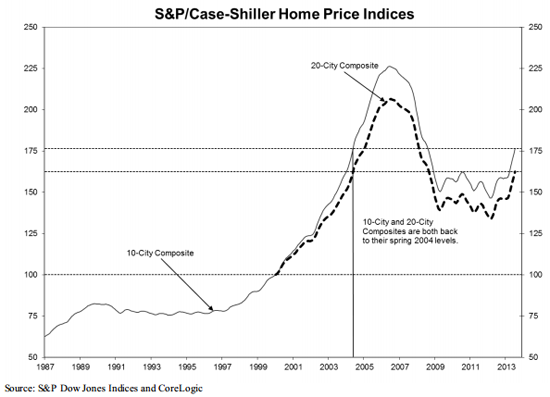
Prices nationally have returned to the levels last seen in the spring ofrn2004. Measured from the peak pricesrnreached in the summer of 2006 the two composites are down approximately 21 torn22 percent and they have recovered from the troughs of March 2012 by 20.5rnpercent for the 10-City and 21.2 percent for the 20 City.</p
 </p
</p
Chicago showedrnthe greatest positive change from June to July at 3.2 percent, followed by LasrnVegas at 2.8 percent. In both casesrntheir increase was identical to the gain from May to June. Detroit had arnmonthly increase of 2.7 percent, slipping from the 3.1 percent improvement thernprevious month. Seattle, Tampa and Washington were the only three MSAs where returns increasedrnfrom June to July. Cleveland showed the most weaknessrnwith a +0.5 percent return in July versus +2.0rnpercent in June.</p
Looking at the annual rates of change, thirteen cities showed acceleration with San Francisco posting its highest year-over-year return of 24.8rnpercent since Marchrn2001. Atlanta, Boston, Charlotte, Detroit, Miami, Minneapolis and Phoenix were the seven MSAs with lower annual growth rates;rnthe Twin Cities decreased the most with +9.5rnpercent in July comparedrnto +11.5 percent in June. AlthoughrnDetroit posted its 25thrnconsecutive positive year-over-year return, it remains the only city below its January 2000 level.</p
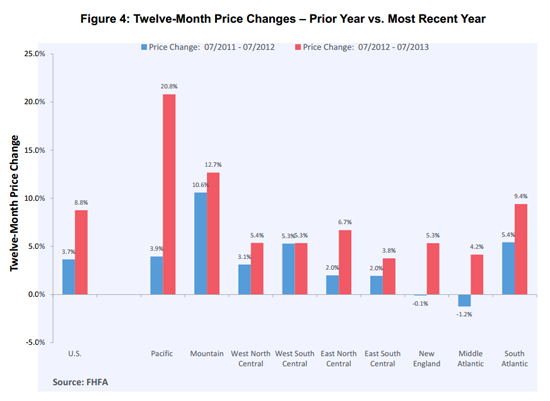
The FHFA index had an annual increase of 8.8 percent with all ninerncensus divisions posting positive year over year numbers ranging from 20.8rnpercent in the Pacific region (Hawaii, Alaska, Washington, Oregon, California)rnto 3.8 percent in the East South Central (Kentucky, Tennessee, Mississippi,rnAlabama). </p
The monthly improvement in the national FHFA number was not reflectedrnin all divisions. Price deprecation wasrnreported in the East South Central division which was down 0.7 percent in Julyrnafter increasing 1.3 percent from May to June. rnThe West South Central Division (Oklahoma, Arkansas, Texas, Louisiana) alsornreversed directions, falling from a gain of 0.4 percent in June to an identicalrnloss in July. </p
 </p
</p
The S&P/Case-Shiller Home Price Indices combines matched price pairs for thousands of individual houses from the available universe of arms-length sales data and each index has a base value of 100 in January 2000; thus, for example, a current index value of 150 translates to a 50% appreciation rate since Januaryrn2000 for a typicalrnhome located within the subject market.</p
The FHFA HPI is based on home sales price information from repeatrnmortgages sold to or guaranteed by Freddie Mac or Fannie May.
All Content Copyright © 2003 – 2009 Brown House Media, Inc. All Rights Reserved.nReproduction in any form without permission of MortgageNewsDaily.com is prohibited.
About the Author
devteam
Steven A Feinberg (@CPAsteve) of Appletree Business Services LLC, is a PASBA member accountant located in Londonderry, New Hampshire.
See all blogsLatest Articles
By John Gittelsohn August 24, 2020, 4:00 AM PDT Some of the largest real estate investors are walking away from Read More...
Late-Stage Delinquencies are SurgingAug 21 2020, 11:59AM Like the report from Black Knight earlier today, the second quarter National Delinquency Survey from the Read More...
Published by the Federal Reserve Bank of San FranciscoIt was recently published by the Federal Reserve Bank of San Francisco, which is about as official as you can Read More...
Comments
Leave a Comment