
Blog

Homeownership Out of Favor. Rentals in Demand
The U.SrnCensus Bureau has released Residential Vacancies and Homeownership data forrnthe first quarter of 2011. rn</p
The data is derived from the Housing Vacancy Survey, which is arnsupplement to the Current Population Survey. The homeowner vacancy rate is thernproportion of the homeowner inventory which is vacant and for sale. The rentalrnvacancy rate is the proportion of the rental inventory which is vacant and forrnrent. A housing unit is vacant if no one is living in it at the time of therninterview, unless its occupants are only temporarily absent. In addition, arnvacant unit may be one which is entirely occupied by persons who have a usualrnresidence elsewhere.</p
QuickrnRecap…..</p
Total Housing Units in the United States: 131.01 million vs.rn130.35 million in Q1 2010</p
How Many Are Occupied: 112.16 million (85.6% of total) vs. 111.41 million in Q1 2010</p<ul type="disc"
How Many Homes Are Vacant: 18.85 million (14.4% of total) vs. 18.94 million in Q1 2010</p
How Many Homes Are Being Held of the Market: 7.37 million (5.6%) vs. 7.1rnmillion in Q1 2010</p
——————-</p
Excerptsrnfrom the Release…</p
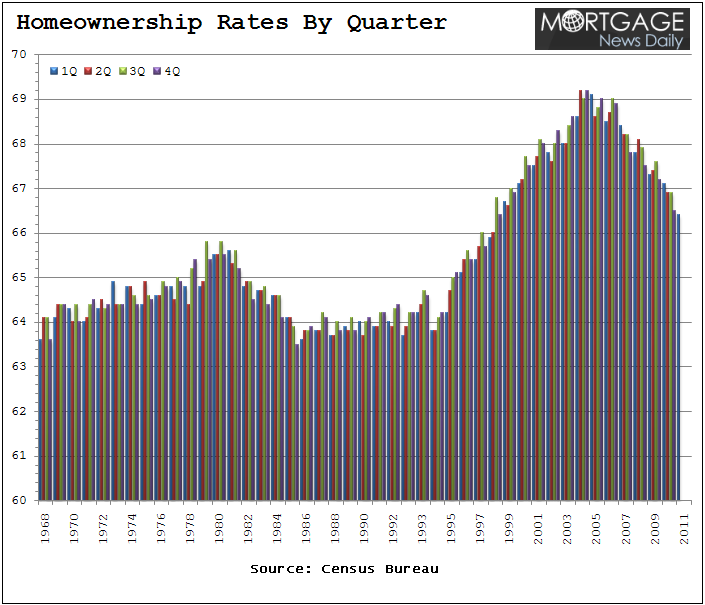
HOMEOWNERSHIP RATES </p
The homeownershiprnrate of 66.4 percent was 0.7 percentage points (+/-0.4%) lower than the firstrnquarter 2010 rate (67.1 percent) and 0.1 percentage points (+/-0.4%) lower thanrnthe rate last quarter (66.5 percent.)</p
REGION: The homeownership rate declined one or two basis points in all fourrnregions from the rate in the fourth quarter of 2010 and was lowest in thernWestern Region at 60.9 percent. The Midwestrnhad the highest rate at 70.4 percent followed by the South at 68.4 percent and thernNortheast at 63.9 percent.</p
AGE: For the first quarter 2011, the homeownership rates were highest forrnthose householders ages 65 years and over (81.0 percent) and lowest for thosernunder 35 years of age (37.9 percent). The rates for all age groups but the oldestrndeclined slightly from one year ago </p
RACE: The homeownership rate for the first quarter 2011 for non-Hispanic White householders reporting a single race was highest at 74.1 percent. The rate for All Other Races householders was second at 56.7 percent and Black Alone householders was lowest, at 44.8 percent. The homeownership rates for non-Hispanic White householders and Black Alone householders were lower than in the first quarter 2010, while the rate for All Other Race householders was not statistically different from one year ago. The homeownership rate for Hispanic householders (who can be of any race), 46.8 percent, was lower than the first quarter 2010 rate.</p
INCOME: The homeownership rate for households with family incomes greater than or equal to the median family income was lower than the first quarter 2010 rate. The rate for those households with family incomes less than the median family income was lower than the rate a year ago</p
 </p
</p
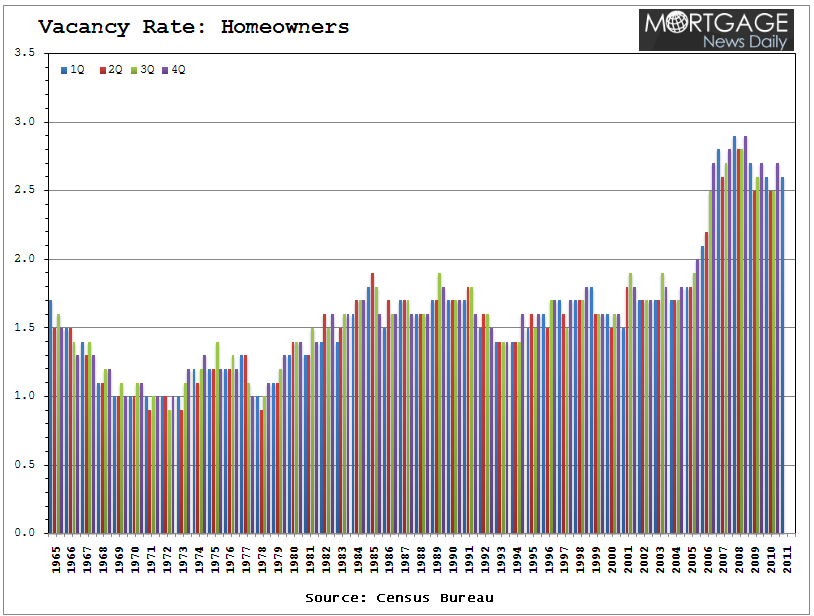
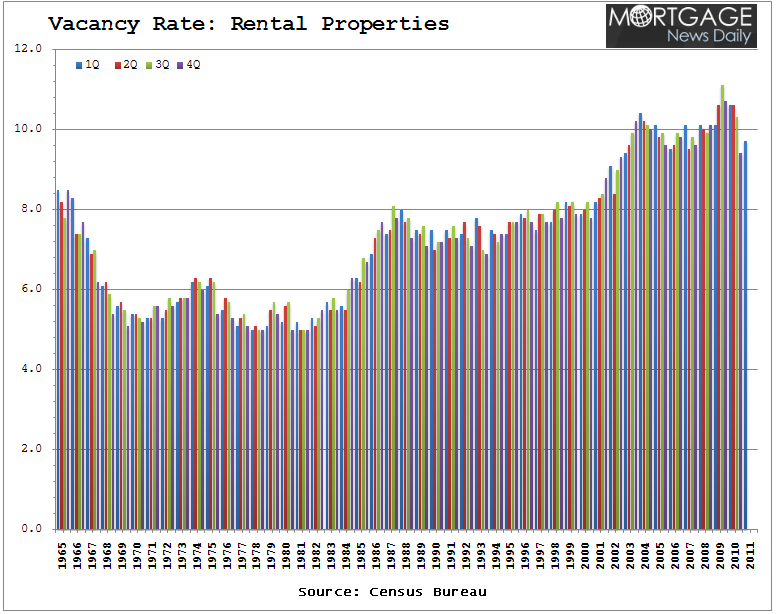
National vacancy rates in the fourth quarter 2010 were 9.7 percent forrnrental housing and 2.6 percent for homeowner housing. In the case of rentalrnhousing, this was a decrease from the 10.7 percent rental vacancy rate reportedrnone year ago, but homeowner vacancies were unchanged.</p
HOMEOWNER VACANCY RATES</p
The homeowner vacancy rate of 2.6 percent was approximately the same as the first quarter 2010 rate (+/-0.2) and 0.1 percentage point lower (+/-0.2) than the rate last quarter (2.7 percent).</p
URBAN VS. SUBURBAN: The homeowner vacancy rate in principal cities (3.3 percent) was higher than in the suburbs (2.4 percent) and outside MSA’s (2.3 percent). The homeowner vacancy rates in principal cities, in the suburbs, and outside MSA’s were not statistically different from the corresponding first quarter 2010 rates.</p
REGION: For the first quarter 2011, the homeowner vacancy rate is higher in the South than in the Northeast and West, but not statistically different from the rate in the Midwest. The homeowner vacancy rate in the Northeast was higher than in the first quarter 2010, while the rates in the Midwest, South, and West were not significantly different from a year ago.</p
 </p
</p
RENTAL VACANCY RATES</p
The rental vacancy rate of 9.7 percent was 0.9 percentage points lower than the rate recorded in the first quarter 2010 (+/-0.5 percentage points) and 0.3 percentage points higher than last quarter (+/-0.4)</p
URBAN VS. SUBURBAN: For rental housing by area, the first quarter 2011 vacancy rates inside principal cities (9.8 percent), in the suburbs (9.3 percent), and outside Metropolitan Statistical Areas (MSA’s) (10.0 percent), were not statistically different from each other. The rental vacancy rate in principal cities was lower than a year ago, while rates in the suburbs and outside MSA’s were not statistically different from the first quarter 2010 rates</p
REGION: Among regions, the rental vacancy rate was highest in the South (12.5 percent). Rates were lower in the Northeast (6.8 percent) and West (7.3 percent), but these rates were not statistically different from each other. The rental vacancy rate in the West was lower than in the first quarter 2010, while the rates in the Northeast, Midwest, and South were statistically unchanged.</p
 </p
</p
Plain and Simple: The homeownership rate has decreased steadily sincernhitting a peak of 69.2 percent in the fourth quarter of 2004 and just fell to its lowest level since the fourth quarter of 1998. More Americans are clearly choosing to orrnbeing forced by credit circumstances to rent rather than buy. This is apparent as the rental vacancy rate has dipped 0.9 percentage points over the past year. WHY? The pool of qualified borrowers shrunk considerably as lending standards have tightend. Plus people are simply choosing to wait it out before buying just in case home prices do indeed double dip (already in process). It’s one big negative feedback loop. Rentals are in demand…watch out for rent inflation in your area!</p
Another Foul Housing Headline. Negative Feedback Loop in Progress</p
Homeownership Rate Hits 10 Year Low. Watch Out for Rent Inflation</p
Home Prices Stuck in Negative Feedback Loop. Would You Buy?</p
Poor Credit Tops List of Homeownership Barriers. Rents Seen Rising</p
Cash Buyers and Qualified Investors Prop Home Sales</p
Tight Credit Limits Home Buyer Demand. Cash is King
All Content Copyright © 2003 – 2009 Brown House Media, Inc. All Rights Reserved.nReproduction in any form without permission of MortgageNewsDaily.com is prohibited.
About the Author
devteam
Steven A Feinberg (@CPAsteve) of Appletree Business Services LLC, is a PASBA member accountant located in Londonderry, New Hampshire.
See all blogsLatest Articles
By John Gittelsohn August 24, 2020, 4:00 AM PDT Some of the largest real estate investors are walking away from Read More...
Late-Stage Delinquencies are SurgingAug 21 2020, 11:59AM Like the report from Black Knight earlier today, the second quarter National Delinquency Survey from the Read More...
Published by the Federal Reserve Bank of San FranciscoIt was recently published by the Federal Reserve Bank of San Francisco, which is about as official as you can Read More...
Comments
Leave a Comment