Blog

Housing Market Normalizing… Very Slowly
Freddie Mac said today that the housingrnrecovery continues to be a primarily local phenomenon. While markets with strong economies andrnfavorable demographics are continuing to improve at a strong pace most marketsrnare still generally weak and the housing market as a whole continues to plodrnalong</p
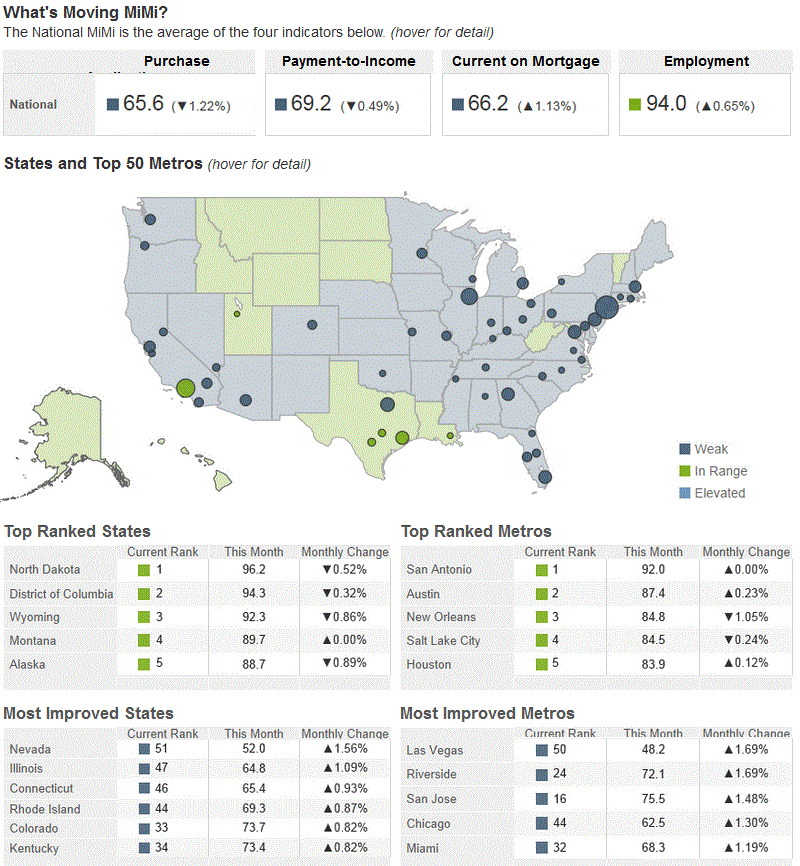
The company released its most recent Multi-Indicator Market Index (MiMi)on Wednesday, with a current value of 73.7. This indicates a weak housing market overall,rnwith only a slight improvement (0.04 percent) from May to June and a 3-monthrnpositive trend of 0.16 percent. On arnyear-over-year basis the MiMi has risen by 7.67 percent. </p
 </p
</p
MiMi combines proprietary Freddie Mac data with current local market data tornassess where the nation’s housing market as well as those in each of the 50rnstates and the District of Columbia and the top 50 metro markets is relative tornits own long-term stable range. Thernindex combines data on home purchase applications, payment-to-income ratiosrn(changes in home purchasing power based on house prices, mortgage rates andrnhousehold income), proportion of on-time mortgage payments and the localrnemployment picture to create a composite MiMi value for each market. </p
Monthly, MiMi uses this data to show, at a glance, where each market standsrnrelative to its own stable range of housing activity and whether each market isrnmoving closer to, or further away from that range. A market can fall outsidernits stable range by being too weak to generate enough demand for arnwell-balanced housing market or by overheating to an unsustainable level ofrnactivity.</p
Thernnation’s all-time MiMi high of 121.87 was June 2008; its low was 59.8 inrnSeptember 2011, when the housing market was at its weakest. Since that time,rnthe housing market has made a 23.3 percent rebound. </p
InrnJune, 21 of the 50 states and 25 of the 50 metros are showing an improvingrnthree month trend. The same time last year, every state plus the District ofrnColumbia, and every metro was showing an improving three month trend. </p
Thirteenrnof the 50 states plus the District of Columbia are considered to be in a stablernrange with North Dakota (96.2) the District of Columbia (94.3), and Wyomingrn(92.3), ranking as the top three. Six ofrnthe 50 metro areas are also considered stable with San Antonio (92.0), Austinrn(87.4), and New Orleans (84.8), leading the list. </p
Nevadarn(+1.56%), Illinois (+1.09%), and Connecticut (+0.93%) were the most improvedrnstates on a monthly basis, while Nevada (+23.5%), Florida (+14.8%), and Illinoisrn(12.9%) improved the most from the previous year. The most improved metro areasrnfrom May to June were Las Vegas and Riverside (tied at +1.69%) followed by SanrnJose (+1.48%). On a year-over-year basisrnthe most improving metro areas were Las Vegas (+26.5%), Riverside, (+19.2%), andrnMiami (+17.2%). </p
Freddie Mac Chief Economist Frank Nothaft said, “As we see the economyrnslowly normalizing we’re starting to see its effects in the housing market asrnwell, albeit very slowly. The good news is the big housing markets, of whichrnsome were also the hardest hit, continue to improve. For example, from the samerntime last year, California is up 12 percent and every market MiMi tracks in thernstate is improving. Meanwhile, Florida is up nearly 15 percent and Illinois isrnup nearly 13 percent over the past year. Likewise, the stalwarts of the recoveryrncontinue to be those states in the North Central section of the country, placesrnlike North Dakota, Montana, Wyoming and then south to Texas and Louisiana. Inrnthese areas not only are markets producing jobs, but better paying jobs thatrntranslate into workers taking out applications to purchase a home and incomerngrowth that keeps homebuyer affordability strong.” </p
Freddie Mac Deputy Chief Economist Len Kiefer pointed out that the currentrnreport includes the first release of quarterly data, providing further analysisrnbeyond the monthly release. “For example, the most improved metro andrnstate markets over the quarter were Las Vegas and Illinois which were up nearlyrn5 and 4 percent respectively. Though Las Vegas has shown considerablernimprovement, it is still a weak market, with the lowest overall MiMi indexrnvalue of 48.2 as of June. Driving the improvement in Illinois over the pastrnthree months is the Employment Indicator which is up 16.9 percent while thernCurrent on Mortgage Indicator is up 3.8 percent since March. In fact, thernEmployment Indicator in Illinois (87.8) moved from Weak to its stable In Rangernstatus over the past quarter, reflecting improvements in local labor marketrnconditions.”
All Content Copyright © 2003 – 2009 Brown House Media, Inc. All Rights Reserved.nReproduction in any form without permission of MortgageNewsDaily.com is prohibited.
Latest Articles
By John Gittelsohn August 24, 2020, 4:00 AM PDT Some of the largest real estate investors are walking away from Read More...
Late-Stage Delinquencies are SurgingAug 21 2020, 11:59AM Like the report from Black Knight earlier today, the second quarter National Delinquency Survey from the Read More...
Published by the Federal Reserve Bank of San FranciscoIt was recently published by the Federal Reserve Bank of San Francisco, which is about as official as you can Read More...

Comments
Leave a Comment