
Blog

Influential Home Price Indices Paint Fuzzy Picture
There are four housing indexes that the country looks to forrninformation on the state of the market. Accordingrnto a report from Standard & Poors (S&P), none of them, eitherrnindividually or in the aggregate, provide a full picture of what, is going on,rna possible concern because of the reliance of both government and industry onrnthese reports to form and react to policy decisions.</p
S&P says that the four reports, The Federal HousingrnFinance Authority (FHFA) Purchase-only Index, First American CoreLogic's LoanPerformancernIndex, the National Association of Realtors®(NAR) Median Home Price Index, andrnthe S&P/Case-Shiller Index; each collect data at least somewhatrndifferently, and the data lags the reporting month by an average of 60rndays. “Consequently,” the reportrnsays, “we believe it's no easy task to get a consistent view of thernsector's health, and it's not uncommon for market participants to formrndifferent opinions about what they think the future will hold in the housingrnmarket.”</p
The financial services company maintains the stance that there is anrninherent sampling bias in the reports because they include homes with valuesrndetermined through an actual sale while excluding those without any hard pricerninformation or even excluding only one price observation. This ultimately skews sample selection whichrnmay lead to instability in home price changes from month to month. “In the absence of other alternatives,rnhowever, it's likely that the market will continue using home index values asrnrough benchmarks for long-term behavior rather than to form opinions based onrnshort-term patterns.”</p
S&P provides the following in order to characterize thernfour indices. </p
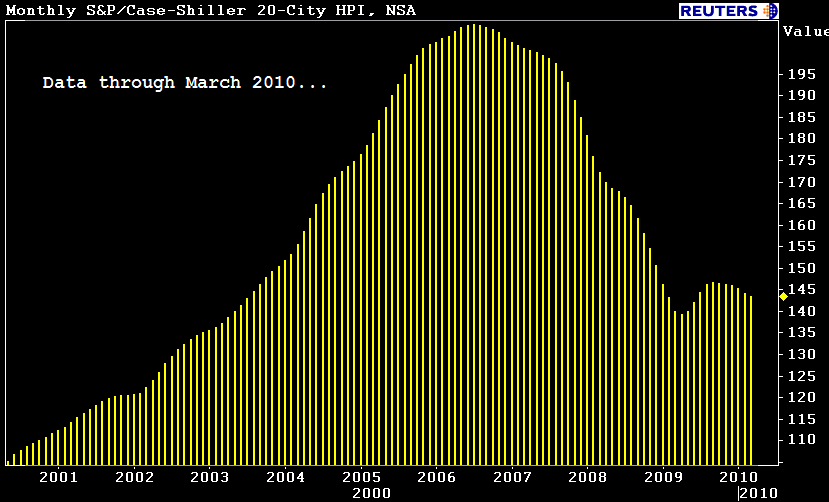
These indices use repeat sales of the same houses torncalculate changes in home prices. Thernindex “family” includes 20 regional indices and two composite indicesrnaggregated across metropolitan areas. rnThe 10-City Composite Home Price Index is a value-weighted average ofrnthe 10 “original” metropolitan area indices and the 20-City Compositernsimilarly evaluates all 20 metro areas.</p
The indicates were assigned a base value of 100 in Januaryrn2000, so an value of 120 today would indicate a 20 percent appreciation in therntypical home's value. The indices arerncalculated monthly and published with a two-month lag. The calculations include homes purchased withrnnon-conforming loans which brings more expensive properties into the sample andrnuses actual sales prices rather than appraised values to derive its numbers. </p
 </p
</p
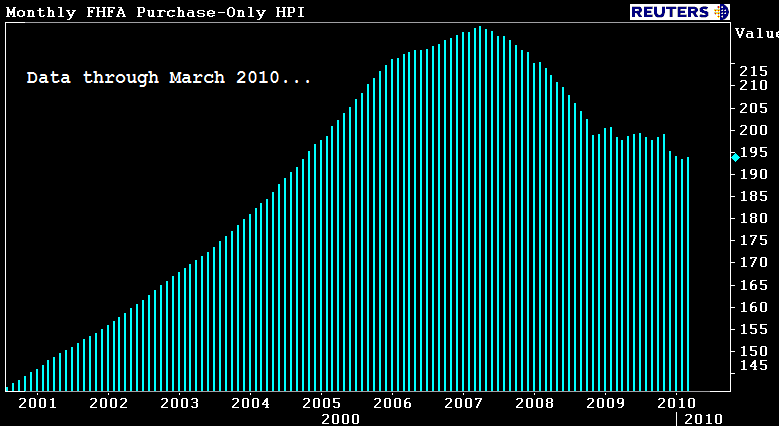
FHFA Purchase-Only Home Price Index</p
This monthly index measures paired repeat sales of singlernfamily homes. A larger FHFA indexrnincludes refinancing in its calculations while the Purchase-Only indexrneliminates appraised values. All salesrnincluded in the index are backed by GSE-backed mortgages. By excluding non-conforming jumbo mortgagesrnthe index may understate deterioration. rnIt also excludes mortgage transactions on attached and multi-unit propertiesrnand properties financed by government guaranteed loans.</p
The index includes home prices in nine Census Bureaurndivisions across 50 states and the District of Colombia. Because of the recent increase inrngovernment-backed mortgages the coverage of the index has increased and it isrnbecoming a broader barometer of current housing prices.</p
 </p
</p
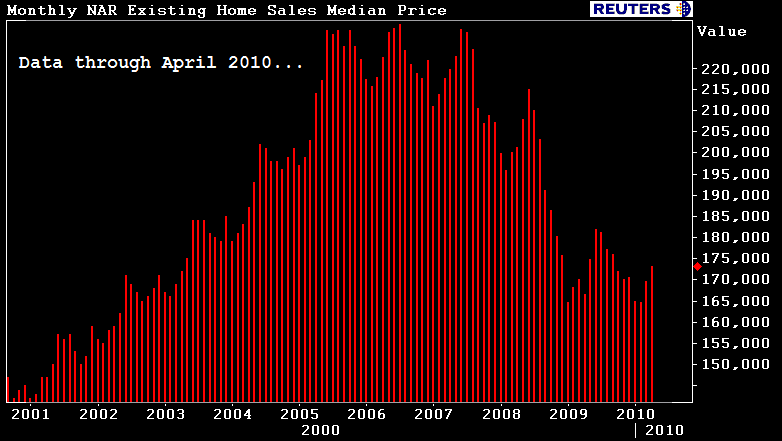
NAR Existing Home Sales Median Price</p
The NAR index measures the median sale prices for existingrnhomes in 20 metropolitan statistical areas. rnThe information is gathered from local Realtor associations andrnnationwide multiple listing services. rnS&P says that the median home price calculation is easy tornunderstand but the sample selection bias causes the mix of homes to shift overrntime.</p
 </p
</p
LoanPerformance Home Price Index</p
This index shows home price behavior based on market-onlyrnsales and on combined sales using market and distress sale data, thus providingrnan insight into the impact of distressed sales. rnThe methodology uses repeat sales over a 30 year database to trackrnchanges over time. It covers 6,173 ZIPrncodes, 569 core-based statistical areas, and 1,016 counties in all 50 statesrnand the District of Colombia.</p
S&P notes the advantages and drawbacks of some of therncharacteristics in each database and methodology. Because they are calculated from past salesrnprices, there is an unsystemic risk aspect to the four indices. They reflect the influence of local issuesrnsuch as unemployment income growth, land supply and demand and localrnregulations. The more forward lookingrnequity indices tend to reflect current and future systemic risks in therneconomy. The report said that, whilernapproaches differ, many real estate observers prefer the repeat sales method tornassess home price changes. In practical application, the Loan Performance andrnS&P/Case-Shiller indices warned of a price decline much earlier than thernFHFA index.</p
Despite month-to-month divergence, the indices generallyrnshow similar trends over the long run. rnTheir volatility, however, varies over time because of the location andrntypes of loans covered, loan limits, data sources, and selection basis.</p
Those indices that are based on repeat sales are most widelyrnused to measure home price behavior but they are also often revised asrnadditional sales become available. Thernmedian price methodology suffers the most from sampling selection bias as thernmix of homes in the sample shifts over time. rnThis shift may also affect the repeat sales-based indices.</p
Because the S&P/Case-Shiller indices are broken down inrnthree price tiers, it is possible to spot trends within the tiers. Those indices as well as the FHFA index highlightrnhow home prices changes have varied considerably across their respectivernuniverses.
All Content Copyright © 2003 – 2009 Brown House Media, Inc. All Rights Reserved.nReproduction in any form without permission of MortgageNewsDaily.com is prohibited.
About the Author
devteam
Steven A Feinberg (@CPAsteve) of Appletree Business Services LLC, is a PASBA member accountant located in Londonderry, New Hampshire.
See all blogsLatest Articles
By John Gittelsohn August 24, 2020, 4:00 AM PDT Some of the largest real estate investors are walking away from Read More...
Late-Stage Delinquencies are SurgingAug 21 2020, 11:59AM Like the report from Black Knight earlier today, the second quarter National Delinquency Survey from the Read More...
Published by the Federal Reserve Bank of San FranciscoIt was recently published by the Federal Reserve Bank of San Francisco, which is about as official as you can Read More...
Comments
Leave a Comment