
Blog

LPS November Delinquency and Forelosure Metrics Muddled
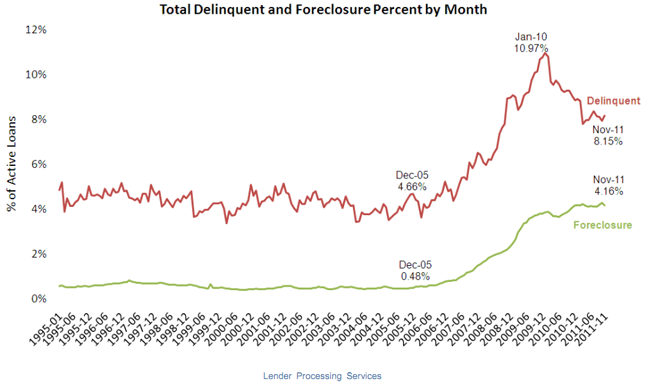
The latest Mortgage Monitor report released by Lender Processing Services, Inc.rn(LPS) presents the kind of mixed message that is now commonplace among thernvarious delinquency reports, foreclosure summaries, home price indices, and housingrnforecasts that fill our inbox. At thernend of November, mortgage delinquencies were down 25 percent from the peak in Januaryrn2010. At the same time, delinquenciesrnwhich had steadily trended downward since July jumped 2.7 percent from Octoberrnto November to a rate of 8.15 percent. rnThis rate, however, is down 9.6 percent from the 9.02 rate of Novemberrn2010.</p
At the same time, new problem loans -rnthose loans seriously delinquent as of the end of November that were currentrnsix months prior – have not improved significantly in the last year. LPS says this degree of stagnation indicatesrnthat while the situation is not getting markedly worse, it is not improvingrneither, and inventories of troubled loans remain significantly higher thanrnpre-crisis levels across the board.</p
Foreclosure starts, both new and repeat,rntotaled 165,205 in November, a decrease of 29.1 percent from the 232,865rnrecorded in October and a 36.3 percent change from November 2010. LPS says this is indicative more of the impactrnof ongoing document reviews, additional state legislation and new regulatoryrnrequirements rather than an actual improvement in conditions.</p
The November foreclosure rate was 4.16 percentrnand the total of seriously delinquent or in foreclosure was 7.72 percent. In comparison, in October these figures werern4.29 percent and 7.70 percent and in November 2010 4.08 percent and 8.17rnpercent respectively.</p
 </p
</p
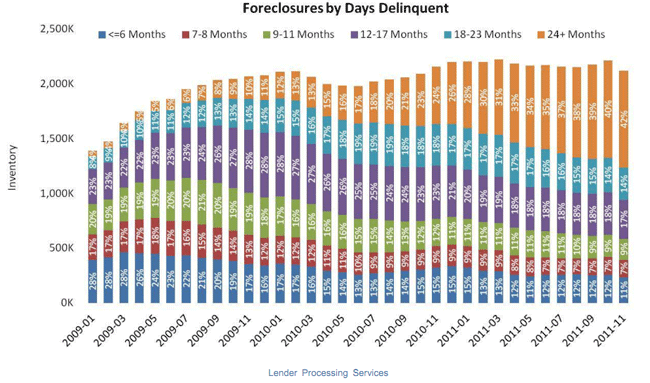
While no explanation was given, thernnumbers of loans rolling back from foreclosure to 90+ day status hit an allrntime high.</p
Foreclosure inventories declined during 3rnpercent in November but the declines were among those loans less than 24 monthsrndelinquent and could be accounted for to an extent by the roll-back mentionedrnabove. Inventories of loans that hadrnbeen delinquent for 2 or more years and in foreclosure rose by 2 percentagernpoints, probably reflecting the inventories in judicial foreclosure statesrnwhere inventories are 2.5 times as large as in non-judicial states. </p
 </p
</p
Prepayment activity – a key indicator ofrnrefinances – remained strong after several consecutive months of growth;rnhowever the October origination data showed a month-over-month drop of nearlyrn12 percent. While still the second highest level for the year, originationsrnthrough October 2011 were down 21 percent vs. the same period in 2010 and downrnalmost 30 percent vs. 2009.</p
The states with the highest percentagernof non-current loans including delinquencies and foreclosures were Florida,rnMississippi, Nevada, New Jersey, and Illinois.
All Content Copyright © 2003 – 2009 Brown House Media, Inc. All Rights Reserved.nReproduction in any form without permission of MortgageNewsDaily.com is prohibited.
About the Author
devteam
Steven A Feinberg (@CPAsteve) of Appletree Business Services LLC, is a PASBA member accountant located in Londonderry, New Hampshire.
See all blogsLatest Articles
By John Gittelsohn August 24, 2020, 4:00 AM PDT Some of the largest real estate investors are walking away from Read More...
Late-Stage Delinquencies are SurgingAug 21 2020, 11:59AM Like the report from Black Knight earlier today, the second quarter National Delinquency Survey from the Read More...
Published by the Federal Reserve Bank of San FranciscoIt was recently published by the Federal Reserve Bank of San Francisco, which is about as official as you can Read More...
Comments
Leave a Comment