
Blog

National Home Prices Show Little Change in Two Indices
Two reports on U.S. home prices were released onrnMonday. The two, the CoreLogic HomernPrice Index (HPI) and the Clear Capital Home Data Index (HDI) cover differentrntime periods and use somewhat different methodology so the data is notrncomparable between the two. Here is arnbrief summary of each. </p
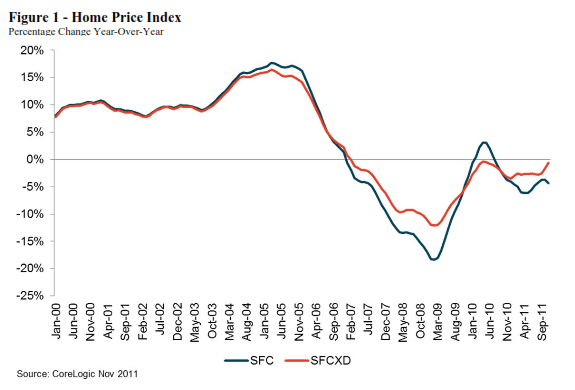
CoreLogic, using a repeat sales index, reports that pricesrnin the U.S. decreased 1.4 percent in November compared to October, the fourthrnconsecutive monthly decline. On arnyear-over-year basis prices, including distressed sales, were down by 4.3rnpercent. This follows a -3.7 percent changernin October 2011 compared to October 2010. rnWhen distressed sales are eliminated, year-over-year sales were down 0.6rnpercent in November following a drop of 1.6 percent in October. </p
Mark Fleming, chief economist for CoreLogic said “With onernmonth of data left to report, it appears that the healthy, non-distressedrnmarket will be very modestly down in 2011. rnDistressed sales continue to put downward pressure on prices, and are arnfactor that must be addressed in 2012 for a housing recovery to become arnreality.”</p
 </p
</p
Including distressed sales, the peak-to-current change inrnthe national HPI (from April 2006 to November 2011) was -32.8 percent. Excluding distressed sales the change wasrn-23.1 percent.</p
The states with the highest percentage of price appreciation</bin November (including distressed sales) were Vermont (+4.3), South Carolinarn(+2.8) , and the District of Columbia (+2.1). rnThe highest rates of depreciation were posted in Nevada (-11.2),rnIllinois (-9.7), and Minnesota (-7.8).</p
Clear Capital reports on both December activity andrnprovides an end of year summary. It generatesrnits indices in rolling quarter intervals that compare the most recent fourrnmonths to the previous three months and includes unweighted data on both fairrnmarket sales and sales of owned real estate (REO). </p
U.S. prices declined 0.4 percent in December, giving backrnsome of the year’s earlier gains ClearrnCapital says this is the first “cooling off” following six months of modestrngains. During that periodrn(June-December) prices were almost flat at -0.1 percent.</p
While national prices were flat in December some localrnmarkets showed substantial volatility. rnDayton, Ohio for example saw a 5.0 percent increase in prices inrnDecember while Atlanta Georgia was down over 18 percent.</p
The national REO saturation rate was at a low point for thernyear in December at 24.8 percent and was also showing consistent signs ofrnstability. Again, it is a localrnsituation with the saturation in Detroit at 48.4 percent and many other marketsrnin the 30-45 percent range while Hartford and Raleigh, North Carolina havernrates only slightly over 5 percent.</p
On a year-over-year basis Clear Capital’s HDI reported arndecrease of 2.1 percent, again reflecting an increasing stabilization of pricesrnand decreasing REO saturation.</p
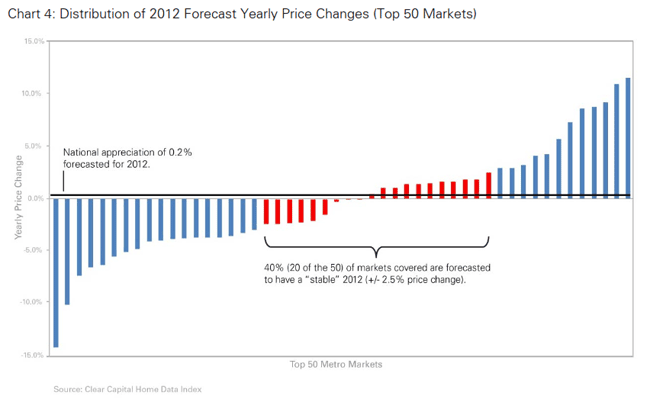
Clear Capital is forecasting rncontinued stabilization into 2012, with U.S. home prices expected tornshow a slight gain of 0.2 percent across all markets, ending five straightrnyears of declines but leaving home prices at levels last seen in 2001. However, while national changes are projectedrnas minimal, the company expects substantial local volatility, with half of thern50 major metro markets in the sample expected to post gains for the year. “Individual metros will experience the fullrngamut of price movement, from double-digit growth to double-digit drops,” therncompany says.</p
Florida is expected to stage a strong comeback in four ofrnits markets. Orlando will have a price increasernof 11.7 percent; Miami and Tampa will be among the five highest performingrnmetros in the country with 8.8 percent and 7.4 percent growth respectively, andrnJacksonville will gain 4.3 percent. Thisrngrowth will be the result of several factors including the beating they tookrnduring the downturn. They have alsornexperienced large increases in the values of their lower-priced homes and haverna high level of cash transactions (51.8 percent) indicating heavy investorrnactivity.</p
The forecasted volatility of the 50 metros in Clear Capital’srnsample is illustrated in the figure below. rnThe black horizontal line represents the predicted 0.2 percent nationalrnprice increase; only 20 of 50 markets fall within +/- 2.5 percent of thernline. These represent the so-called “stable”rnmarkets.</p
All Content Copyright © 2003 – 2009 Brown House Media, Inc. All Rights Reserved.nReproduction in any form without permission of MortgageNewsDaily.com is prohibited.
About the Author
devteam
Steven A Feinberg (@CPAsteve) of Appletree Business Services LLC, is a PASBA member accountant located in Londonderry, New Hampshire.
See all blogsLatest Articles
By John Gittelsohn August 24, 2020, 4:00 AM PDT Some of the largest real estate investors are walking away from Read More...
Late-Stage Delinquencies are SurgingAug 21 2020, 11:59AM Like the report from Black Knight earlier today, the second quarter National Delinquency Survey from the Read More...
Published by the Federal Reserve Bank of San FranciscoIt was recently published by the Federal Reserve Bank of San Francisco, which is about as official as you can Read More...
Comments
Leave a Comment