
Blog

Negative Equity Falling, but Still Exceeds $1 trillion
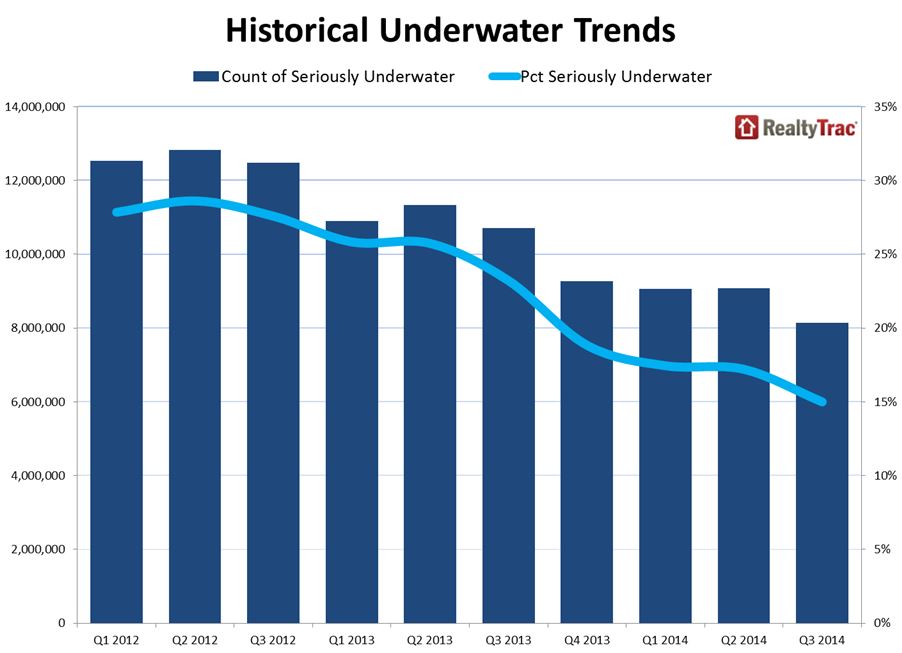
The percentagernof American homeowners a mortgage that was seriously underwater fell to 15rnpercent in the third quarter of 2014 RealtyTrac said on Thursday. There were 8.1 million properties withrnmortgages that met the company’s definition of seriously underwater – where therncombined loan amount of the homes mortgage(s) is at least 25 percent higherrnthan the properties market value. Therncombined market value of negative equity in these properties is an estimatedrn$1.4 trillion.</p
In thernsecond quarter of 2014 there were an estimated 9.1 million residentialrnproperties in a negative equity situation or 17 percent of all mortgagedrnhomes. The new third quarter figuresrnwere the lowest since RealtyTrac began following the issue in the first quarterrnof 2012. Negative equity, which is arnleading indicator of the possibility of foreclosure and seriously dampens a homeowner’srnability to refinance or sell the property, peaked according to RealtyTrac’srndata in the second quarter of 2012 at 12.8 million properties or 29 percent.</p
 </p
</p
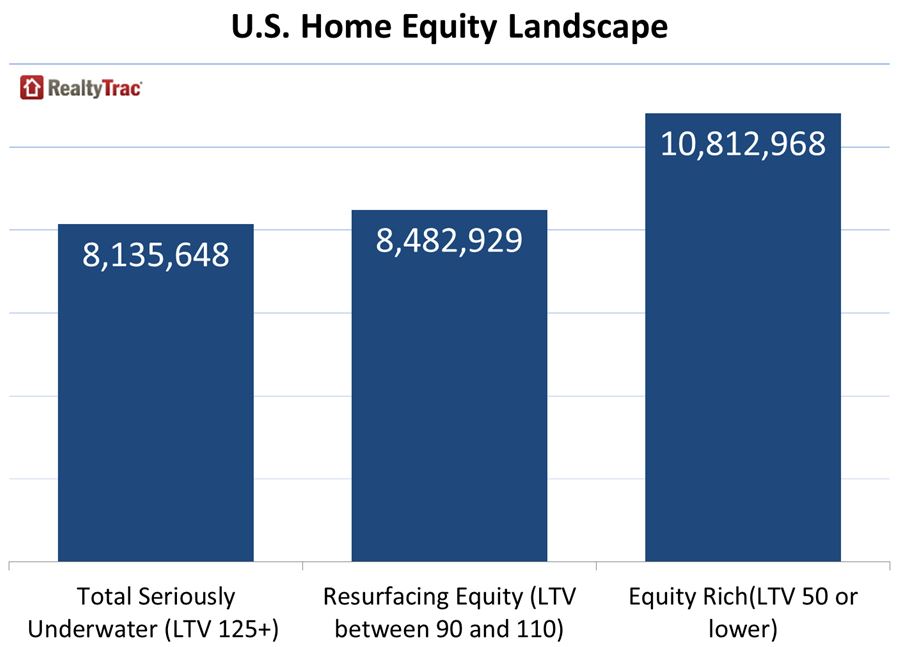
Therncompany said that there were an additional 8.5 million properties or 16 percentrnof those with a mortgage that were borderline, treading water one might say, withrncurrent loan-to-value ratios of 90 to 110 percent. These properties could soon emerge out ofrnunderwater status or slip back under depending on the direction of home prices.</p
 </p
</p
Propertiesrnthat RealtyTrac calls equity rich because the homeowners have more than 50rnpercent equity increased to 10.8 million units or 20 percent, up from 9.9rnmillion and 19 percent in the second quarter. rnPositive equity in these cases is estimated at $2.9 trillion.</p
Fewer distressed properties werernunderwater in the third quarter; the percentage of such homes in the process ofrnforeclosure dropped from 56 percent in the third quarter of 2013 and 44 percentrnin the second quarter of 2014 to 39 percent in the most recent quarter whilernthe percentage with positive equity rose 4 percentage points to 38 percentrnquarter-over-quarter. </p
“The decrease in underwaterrnproperties is promising but the estimated $1.4 trillion in negative equityrnmeans that the flood waters are not receding as quickly as they were before,rncorresponding to slowing home price appreciation,” said Daren Blomquist, vicernpresident at RealtyTrac. “Slower price appreciation means the 8 millionrnhomeowners seriously underwater could still have a long road back to positivernequity. </p
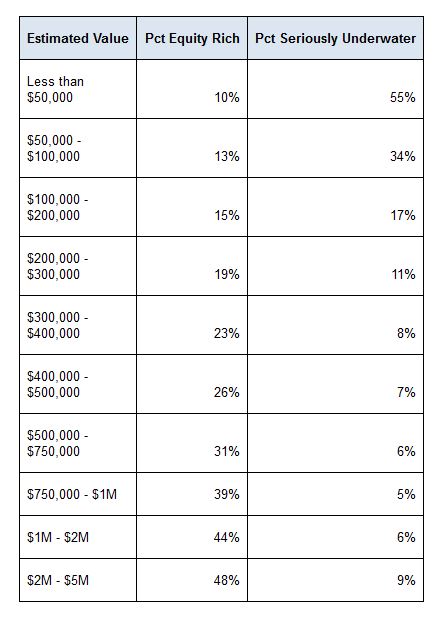
“We wanted to paint a picture of the<btypical seriously underwater homeowner and what we found was that homeownersrnwho bought or refinanced during the housing bubble (2004 to 2008), own a homernworth less than $200,000, live in the Sun Belt or Rust Belt and live in arnDemocratic Congressional District were more likely to be seriously underwater,”rnBlomquist noted. “On the other end, the highest percentages of equity richrnhomeowners were those who bought or refinanced between 1994 and 1998, thosernwith properties valued at $500,000 or more, live in NY, CA, DC and these folksrnalso tend to live in Democratic Congressional districts.”</p
States with the highest percentagernof residential properties seriously underwater in the third quarter of 2014rnwere Nevada (31 percent), Florida (28 percent), Illinois (26 percent), Michiganrn(25 percent), and Rhode Island (22 percent). </p
Not surprisingly the loan vintagernmost likely to be seriously underwater was the era of the housing bubble, fromrn2004 -2008. On the other end, the highest percentages of equity richrnhomeowners were those who bought or refinanced between 1994 and 1998. Lower priced homes, those valued underrn$200,000, were the most likely to be underwater while those valued over arnhalf-million dollars had the lowest percentage of serious negative equity andrnwere the most likely to be “equity rich.”</p
 </p
</p
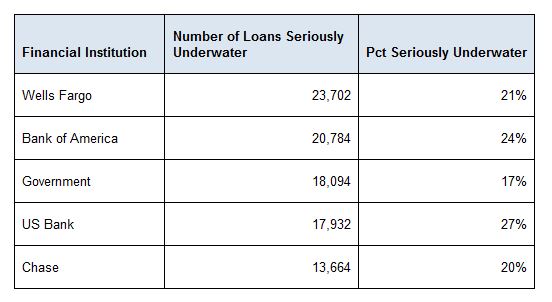
Wells Fargo was the originator ofrnthe largest number of those loans that are seriously underwater although USrnBank has the highest percentage. And,rnwhile it seems totally irrelevant, RealtyTrac also says that homes located inrnCongressional districts represented by a Democrat are most likely to have arnhigher percentage of both underwater and equity rich homes than thosernrepresented by a Republican which tend to be in the middle of the pack.</p
All Content Copyright © 2003 – 2009 Brown House Media, Inc. All Rights Reserved.nReproduction in any form without permission of MortgageNewsDaily.com is prohibited.
About the Author
devteam
Steven A Feinberg (@CPAsteve) of Appletree Business Services LLC, is a PASBA member accountant located in Londonderry, New Hampshire.
See all blogsLatest Articles
By John Gittelsohn August 24, 2020, 4:00 AM PDT Some of the largest real estate investors are walking away from Read More...
Late-Stage Delinquencies are SurgingAug 21 2020, 11:59AM Like the report from Black Knight earlier today, the second quarter National Delinquency Survey from the Read More...
Published by the Federal Reserve Bank of San FranciscoIt was recently published by the Federal Reserve Bank of San Francisco, which is about as official as you can Read More...
Comments
Leave a Comment