
Blog

New Credit Accessibility Measure Weighs Lender Risk
The HousingrnFinance Policy Center, part of the Urban Institute, has released a new measure ofrncredit availability. In an article inrnthe Urban Institute’s blog, Metro Blog, Wei Li and LauriernGoodman talk about the initial findings from their measure, the CreditrnAvailability Index or HCAI, that product not borrower risk fueled the housingrnbubble. </p
We will return to those findings later, but first an explanation of how thernIndex is calculated and, more interestingly, how the authors compare it to others thatrnattempt to measure credit accessibility; thernFederal Reserve’s Senior Loan OfficerrnOpinion Survey on Bank LendingrnPractices (SLO), mortgage application denial rates based on annual Home MortgagernDisclosure Act (HMDA) data; the MortgagernCredit Availability Indexrnproduced by the MortgagernBankers Association (MBA), and medianrnborrower’s credit scorernat origination. Li and Goodman claim these measures sufferrnvariously from being too narrow, too subjective, limited in time, opaque, orrninaccurate in certain situations.</p
While each has covered a different time frame, this is how these indicesrnhave measured credit availability. </p
 </p
</p
The quarterly SLO measures credit accessibility qualitatively by calculating the net share of banks that reportrnhaving tightened standards over the previous three months “considerably” or “somewhat” minusrnthe fraction of banks thatrnreported having easedrnstandards in such measure. Sixty large domestically chartered commercialrnbanks currently complete this survey voluntarily and electronically. Because thernsurvey compares the currentrnmonth against the previous three, however,rnit does not capture changes in creditrnaccessibility over a longer period. </p
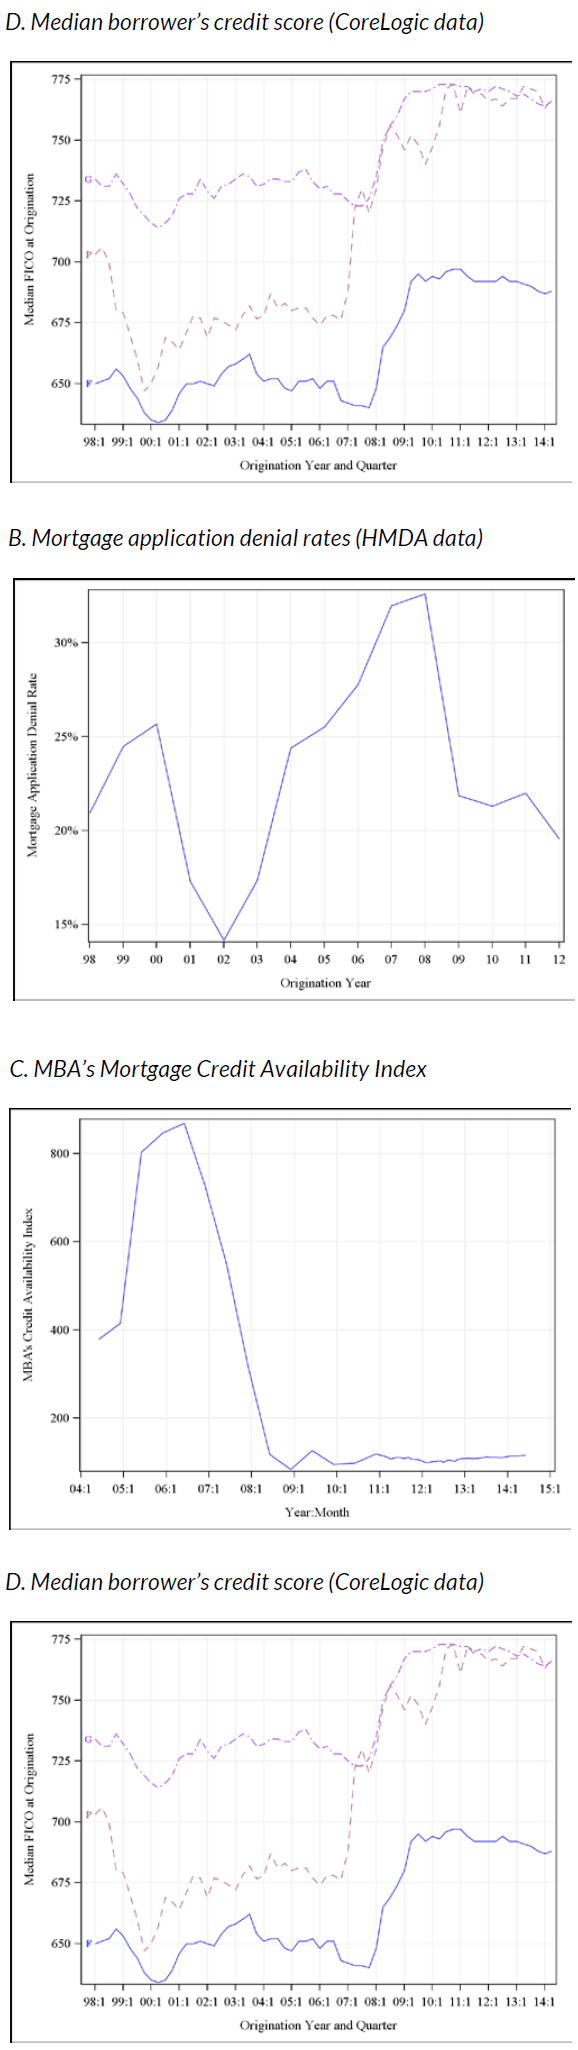
Figure 1A shows that in Q2 2007 the SLO indicatedrna net tightening of credit standards for prime mortgages of only 15 percent</bwhich climbed to 74 percent in Q3 2008 but it does not capture the looseningrnbetween 2003 and 2007. It also failed tornrecognize the popularity of risky products as a sign of loosening creditrnstandards before the financial crisis and did not begin asking separately aboutrnchanges in standards for prime, non-traditional, and subprime loans until Q2rn2007, thus missing a critical change. rnThe reliance on large commercial banks for reporting also excluded majorrnplayers like Countrywide and Ameriquest.</p
Researchers use HMDA data to calculate denial rates as a measurernof credit accessibility, usually as the number ofrnapplications denied divided by the total number of applications. This fails to take into account thernapplicants’ credit profiles. An increasernin applications by weaker-credit borrowers could increase the denial rate andrnindicate tighter credit access even when the actual credit environment has notrnchanged. This accounts for the counterintuitive trendrnin figure 1.B: denial rates increaserneach year from 2002 throughrnthe boom, reaching a peak in 2007 and 2008, and fall again as the bottomrnfalls out of the marketrnin 2009.</p
Li and Goodman say that the MBA’s MCAI whichrnis relatively new, uses AllRegs to scan therncredit guidelines for a largernnumber of lenders, then aggregates the results intorna single number. The resulting trendrnbetween 2004 and the present, shown in figure 1C is quite reasonablernthey say, but the index lacks transparency. “Though we know,rnfor example, thatrnthis index takesrnmany factors intornaccount (such as loan purpose,rnamortization type, and property type)rnwe havernno way to know how numbers are assigned to these factorsrnor to assess the formularnthat converts these manyrnfactors into a single indexrnnumber.”</p
The fourth measure of creditrnaccessibility is the credit characteristics of loans made to the medianrnborrower. This does reflect the amountrnof risk the market is willing and expected to take at a given time, for examplernthe big jump in credit scores after the financial crisis. But the measure, in the authors’ eyes, hasrntwo weaknesses. First, a credit scorernalone is insufficient as a measure of credit availability (disregarding as it doesrnLTV, DTI, and other metrics) and the results using this measure arerncounterintuitive. They show a slightrnincrease in medianrnFICO scores for the private-label and bank portfolio channelrnbetween 2000 and 2006, indicating declining credit accessibility over a periodrnwidely perceived as driven by increasing accessibility. Similar to what was noted about the HMDArndata, this was driven less by the amount of credit in the market than by thernkinds of people applying for loans and the kinds of loans they were seeking. </p
Li and Goodman say that conceptually the marketrnincreases credit availability by taking more default risk so an alternative tornthe four existing measures is to look at the amount of default risk the marketrntakes on at a given time. This gives a single comprehensive snapshot of thernmarket that takes into account both accessibility and risk. Second, this measure more directly tracksrnmarket reality; a lower value indicates the market is taking less risk and makingrncredit less accessible; a high value indicates the reverse.</p
Torndetermine the default risk of a newly originated home purchase loan, operationallyrnthe HCAI probes an enormous database of historic loans to find a set that mostrnclosely matches the borrower characteristics and loan risk of the loan ofrninterest. It then searches for and uses twornhistoric default rates to determine the likely default risk of a newlyrnoriginated loan:</p<ol start="1" type="1"
It weights these two default rates according to the likelihood of normal orrnstressed scenario, assigning a 90 percent chance for a normal economicrnenvironment and a 10 percent chance for a stressed economic environment. Thernresulting number is the expected default risk the market takes in making thisrnnew loan or group of loans. Thisrnidentifies with specificity the likelihood that a specific loan or group ofrnloans will default and how much that default risk is due to the loan type vs.rnthe borrower. </p
 </p
</p
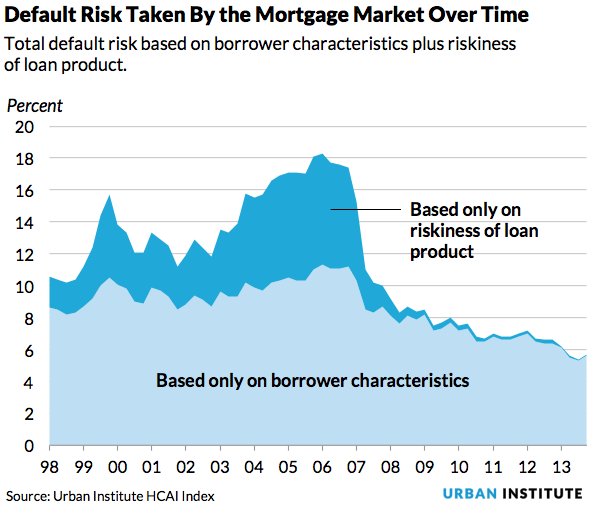
The authors say this figure shows “one of the most startling insightsrnrevealed by the HCAI: Product risk, not borrower risk, fueled the housing bubble.” The mortgage default risk thernmarket was willing to take peaked significantly from 2005-2008 and that in thernbubble years, the market took almost twice the product risk it took in thernpre-bubble years, while borrower risk held steady.</p
The HCAI also reveals that post-crisis, the mortgage market almost ceased tornprovide loans with risky terms and significantly curtailed its willingness tornaccept any borrower risk, dipping well below the level held nearly steady fromrn1998 to 2007. More recently, lenders have been taking only two-thirds of thernborrower risk they consistently maintained in the pre-bubble and bubble years,rnwhich they call a tremendous over-correction.</p
Goodman and Li say that their measure will allow more accurate answers tornsuch questions as: </p<ul class="unIndentedList"<liWhat segments of the mortgage market are servingrnborrowers with less than pristine credit today and how well are they servingrnthese borrowers?</li<liWhat percent of the FHA-guaranteed loans madernlast year (or at any point in time) will default?</li<liHow much will defaults rise if we loosen currentrnGSE-lending standards?</li<liHow tight are credit standards today?</li
All Content Copyright © 2003 – 2009 Brown House Media, Inc. All Rights Reserved.nReproduction in any form without permission of MortgageNewsDaily.com is prohibited.
About the Author
devteam
Steven A Feinberg (@CPAsteve) of Appletree Business Services LLC, is a PASBA member accountant located in Londonderry, New Hampshire.
See all blogsLatest Articles
By John Gittelsohn August 24, 2020, 4:00 AM PDT Some of the largest real estate investors are walking away from Read More...
Late-Stage Delinquencies are SurgingAug 21 2020, 11:59AM Like the report from Black Knight earlier today, the second quarter National Delinquency Survey from the Read More...
Published by the Federal Reserve Bank of San FranciscoIt was recently published by the Federal Reserve Bank of San Francisco, which is about as official as you can Read More...
Comments
Leave a Comment