
Blog

New Home Inventory Shrinking as Construction Stagnates
The Census Bureau and Department of Housing and Urban Development havernreleased NewrnResidential Sales data for June 2011.</p
New Residential Sales data provides statistics on the sales of newrnprivately-owned single-family residential structures in the United States. Datarnincluded in the press release are (1) the number of new single-family housesrnsold; (2) the number of new single-family houses for sale; and (3) the medianrnand average sales prices of new homes sold. New residential sales estimatesrnonly include new single-family residential structures. Sales of multi-familyrnunits are excluded from these statistics.</p
Here is a Quick Recap from Reuters…</p
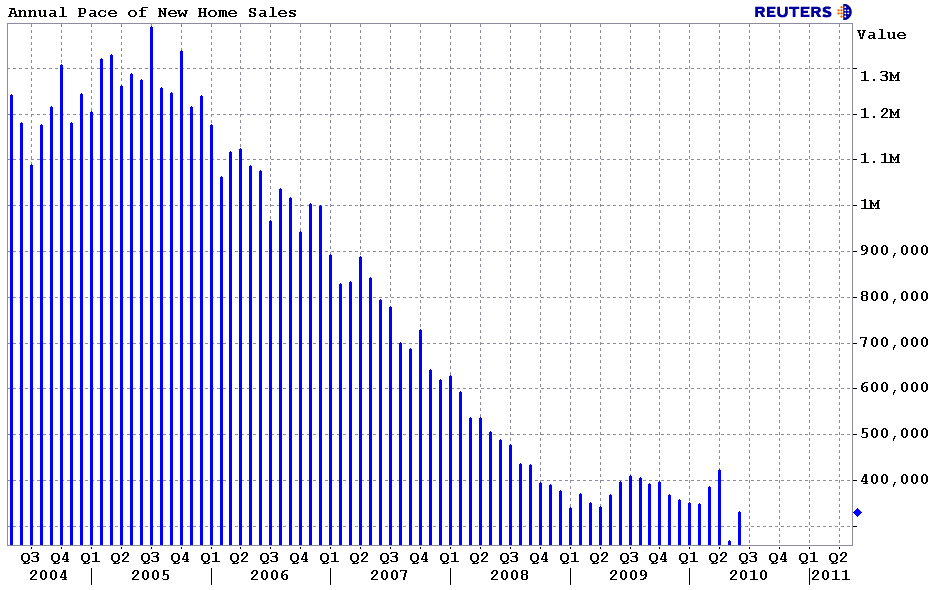
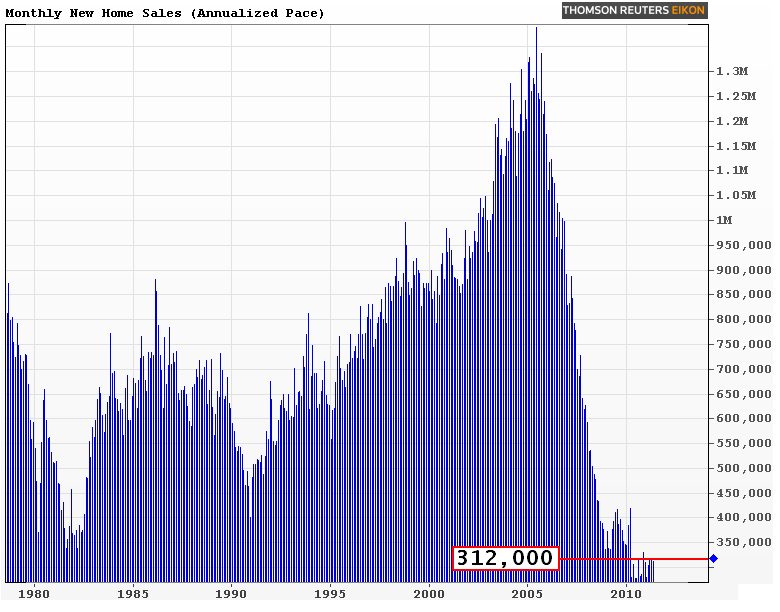
RTRS – US JUNE SINGLE-FAMILY HOME SALES 312,000 UNIT ANN.rnRATE (CONS 320,000) VS MAY 315,000 (PREV 319,000) </p
RTRS – US JUNE SINGLE-FAMILY HOME SALES -1.0 PCT VS MAY -0.6rnPCT (PREV -2.1 PCT) </p
RTRS – US JUNE HOME SALES NORTHEAST -15.8 PCT, MIDWEST +9.5rnPCT, SOUTH +3.4 PCT, WEST -12.7 PCT </p
RTRS – US JUNE NEW HOME SUPPLY 6.3 MONTHS’ WORTH AT CURRENTrnPACE, LOWEST SINCE APRIL 2010, VS MAY 6.4 MONTHS </p
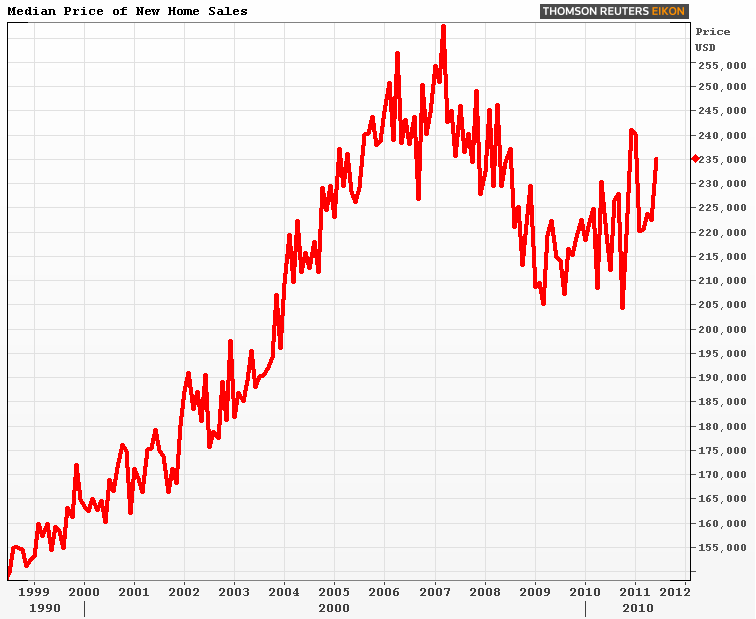
RTRS – US JUNE MEDIAN SALE PRICE $235,200, +7.2 PCT FROMrnJUNE 2010 ($219,500) </p
RTRS – US HOMES FOR SALE AT END OF JUNE RECORD LOW 164,000rnUNITS VS MAY 167,000 UNITS</p
</p
 </p
</p
Excerpts from the Release…</p
Sales of new single-family houses in June 2011 were at arnseasonally adjusted annual rate of 312,000, according to estimates released jointly today by the U.S. Census Bureaurnand the Department of Housing and Urban Development. This is 1.0 percent (±12.5%)* below the revised May rate ofrn315,000, but is 1.6 percent (±14.1%)* above the June 2010 estimate of 307,000.</p
 </p
</p
The seasonally adjusted estimate of new houses for sale at thernend of June was 164,000. This represents a supply of 6.3 months at the current sales rate. The median sales price of new houses sold in June 2011 wasrn$235,200; the average sales price was $269,000.</p
 </p
</p
A few observations…</p<ol
READ MORE: Lending Opportunity Seen in Home Rehab Biz
All Content Copyright © 2003 – 2009 Brown House Media, Inc. All Rights Reserved.nReproduction in any form without permission of MortgageNewsDaily.com is prohibited.
About the Author
devteam
Steven A Feinberg (@CPAsteve) of Appletree Business Services LLC, is a PASBA member accountant located in Londonderry, New Hampshire.
See all blogsLatest Articles
By John Gittelsohn August 24, 2020, 4:00 AM PDT Some of the largest real estate investors are walking away from Read More...
Late-Stage Delinquencies are SurgingAug 21 2020, 11:59AM Like the report from Black Knight earlier today, the second quarter National Delinquency Survey from the Read More...
Published by the Federal Reserve Bank of San FranciscoIt was recently published by the Federal Reserve Bank of San Francisco, which is about as official as you can Read More...
Comments
Leave a Comment