
Blog

New Home Sales Follow Building Permits Lower
The Census Bureau and Department of Housing and Urban Development have released New Residential Sales data for February 2011.
New Residential Sales data provides statistics on the sales of new privately-owned single-family residential structures in the United States. Data included in the press release are (1) the number of new single-family houses sold; (2) the number of new single-family houses for sale; and (3) the median and average sales prices of new homes sold.
A house is considered sold when either a sales contract has been signed or a deposit accepted. Included in our estimates are houses for which a sales contract is signed or deposit accepted before construction has actually started; for instance, houses sold from a model or from plans before any work has started on the footings or foundations. These estimates also include houses sold while under construction or after completion. This survey does not follow through to the completion (“closing”) of the sales transaction, so even if the transaction is not finalized, the house is still considered sold. Preliminary new home sales figures are subject to revision due to the survey methodology and definitions used. The survey is primarily based on a sample of houses selected from building permits.
New residential sales estimates only include new single-family residential structures. Sales of multi-family units are excluded from these statistics.
Here is a Quick Recap from Reuters…</p
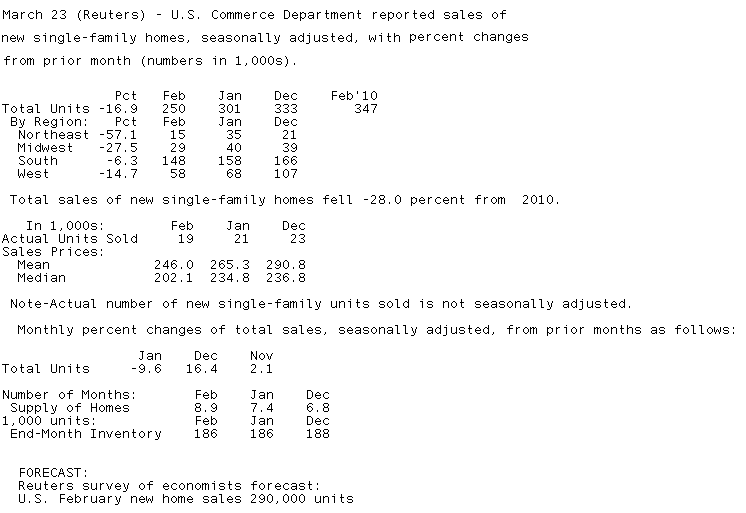
RTRS-US FEB SINGLE-FAMILY HOME SALES RECORD LOW 250,000 UNIT ANN. RATE (CONS 290,000) VS JAN 301,000 (PREV 284,000)
RTRS-US FEB SINGLE-FAMILY HOME SALES -16.9 PCT VS JAN -9.6 PCT (PREV -12.6 PCT)
RTRS-US FEB HOME SALES NORTHEAST -57.1 PCT, MIDWEST -27.5 PCT, SOUTH -6.3 PCT, WEST -14.7 PCT
RTRS-US FEB NEW HOME SUPPLY 8.9 MONTHS’ WORTH AT CURRENT PACE VS JAN 7.4 MONTHS
RTRS-US FEB MEDIAN SALE PRICE $202,100, -8.9 PCT FROM FEB 2010 ($221,900)
RTRS-US HOMES FOR SALE AT END OF FEB 186,000 UNITS VS JAN 186,000 UNITS
RTRS-US FEB MEDIAN SALE PRICE LOWEST SINCE DEC 2003 ($196,000)
RTRS-TABLE-U.S. Feb single-family home sales fell 16.9 pct</p
 </p
</p
Excerpts from the Release….
</p
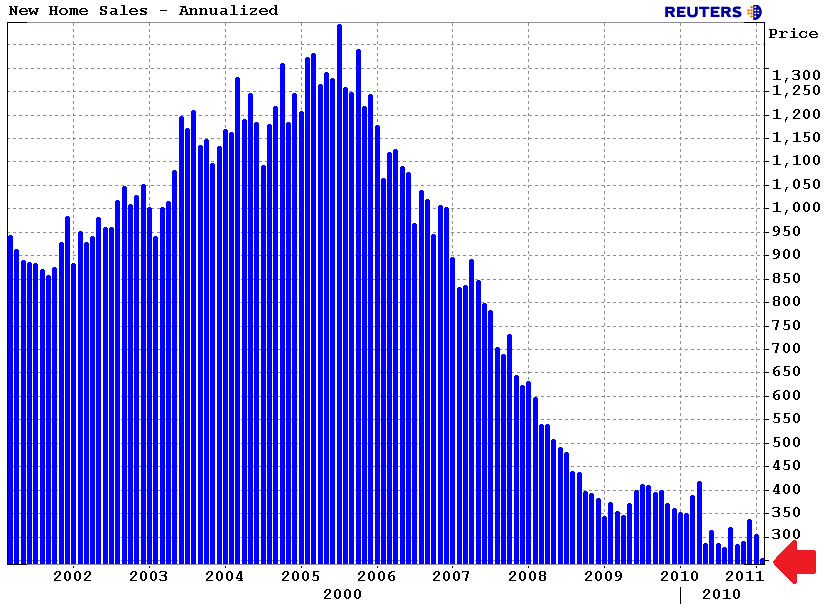
Sales of new single-family houses in February 2011 were at a seasonally adjusted annual rate of 250,000. This is 16.9 percent (±19.1%)* below the revised January rate of 301,000 and is 28.0 percent (±14.8%) below the February 2010 estimate of 347,000.</p
The red arrow denotes a record low for New Home Sales…</p
 </p
</p
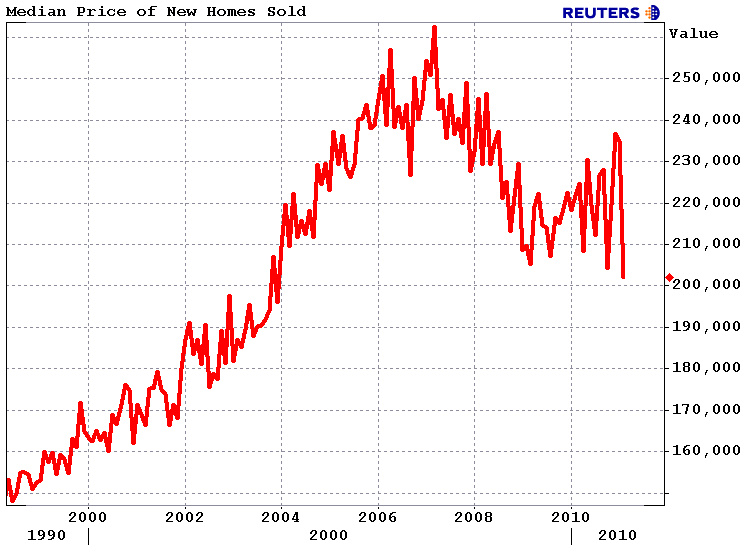
The seasonally adjusted estimate of new houses for sale at the end of February was 186,000. This represents a supply of 8.9 months at the current sales rate. The median sales price of new houses sold in February 2011 was $202,100; the average sales price was $246,000. </p
This is the lowest median New Home price since December 2003…</p
 </p
</p
No surprises here. The New Home Sales survey is primarily based on a sample of houses selected from building permits. That means we can look to Building Permits data for an indication of New Home Sales to come (not to come). Well….Single-family Building Permits in February were at a rate of 382,000, which is 9.3 percent below the revised January figure of 421,000. New Home Sales simply followed their survey sampling lower…..</p
Besides that….the standard of error was once again huge at ±19.1%. </p
More explanation from the Census Bureau: “These statistics are estimated from sample surveys. They are subject to sampling variability as well as nonsampling error including bias and variance from response, nonreporting, and undercoverage. Estimated average relative standard errors of the preliminary data are shown in the tables. Whenever a statement such as “2.5 percent (±3.2%) above” appears in the text, this indicates the range (-0.7 to +5.7 percent) in which the actual percent change is likely to have occurred. All ranges given for percent changes are 90-percent confidence intervals and account only for sampling variability. If a range does not contain zero, the change is statistically significant. If it does contain zero, the change is not statistically significant; that is, it is uncertain whether there was an increase or decrease. The same policies apply to the confidence intervals for percent changes shown in the tables.”
This month the Standard Error was “-16.9 percent (±19.1%)”
TRANSLATION: With 90% certainty, the Census Bureau survey indicates the month over month percentage change in New Home Sales was between -36% and +2.2%. We don’t know if New Home Sales improved or declined! The standard error is so big that it distorts the data…we must considered it “statistically insignificant”.</p
All Content Copyright © 2003 – 2009 Brown House Media, Inc. All Rights Reserved.nReproduction in any form without permission of MortgageNewsDaily.com is prohibited.
About the Author
devteam
Steven A Feinberg (@CPAsteve) of Appletree Business Services LLC, is a PASBA member accountant located in Londonderry, New Hampshire.
See all blogsLatest Articles
By John Gittelsohn August 24, 2020, 4:00 AM PDT Some of the largest real estate investors are walking away from Read More...
Late-Stage Delinquencies are SurgingAug 21 2020, 11:59AM Like the report from Black Knight earlier today, the second quarter National Delinquency Survey from the Read More...
Published by the Federal Reserve Bank of San FranciscoIt was recently published by the Federal Reserve Bank of San Francisco, which is about as official as you can Read More...
Comments
Leave a Comment