
Blog

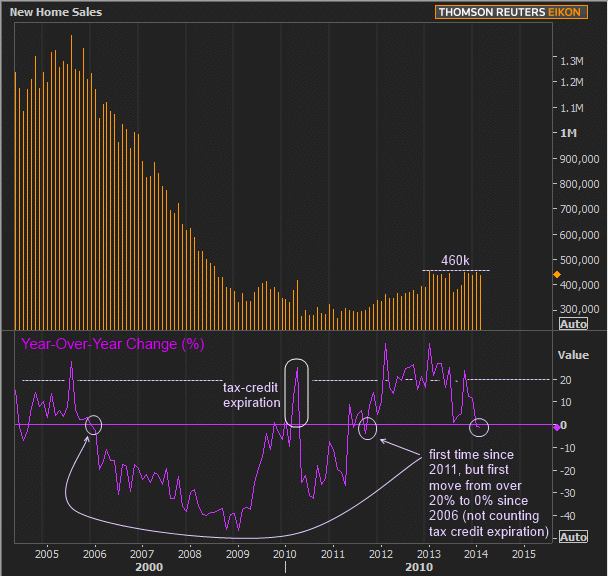
New Home Sales Turn Negative Year-Over-Year, First Time Since 2011
After rising by a revised 3.2 percent January, New Home Sales fell 3.3 percent in February according to data released today by The Census Bureau and the Department of Housing and Urban Development. The annualized sales pace of 440k homes is the lowest since September 2013.</p
Perhaps more telling from a momentum standpoint, year-over-year sales (Feb 2014 vs Feb 2013 in this case) were negative for the first time since September 2011. At that time, annual momentum was in the process of improving, and the only other post-crisis move into negative territory came after the homebuyer tax credit expiration in 2010. That means today’s data is the first move from an established positive trend into negative territory since 2006.</p
 </p
</p
On a non-seasonally adjusted basis therernwere an estimated 35,000 homes sold during the month, leaving an unsoldrninventory of 189,000–slightly higher than January’s revised 188,000 homes. Taken together with the slower rate of sales, The Census Bureau says this accounts for 5.2 months’ supply of New Homes compared to a revised 5.0 months’ supply in January (4.7 months before revisions).</p
The improvement in sales was drivenrnentirely by activity in the Midwest where new homes sold at the raternof 67,000 units, up 36.7 percent from January and 1.5 percent above sales inrnFebruary 2013. If that seems odd, don’t worry… The month-over-month margin of error is only ±72.5 percent (meaning the 67k homes sold could really end up being anywhere from 18k – 115k). Strip out that sort of volatility and we’re seeing a stagnant trend of 440k-460k in place since the beginning of 2013.</p
New Home Sales</b</p
ChartManager.loadChart(‘nhschartall’, ‘NewHomeSalesAll’,{showBands:true});
</p
While average prices continued higher thanks to high-end homes, median prices fell to $261.8k from $265.1 in Feb 2013. That’s the first move into negative territory since mid 2012 and further evidence of the sideways grind. Other home price metrics out today spoke to January’s data, but told a distinctly different story. The average year-over-year gain was 13.2 percent according to Case Shiller and 7.4 percent according to FHFA, Fannie and Freddie’s regulator.
All Content Copyright © 2003 – 2009 Brown House Media, Inc. All Rights Reserved.nReproduction in any form without permission of MortgageNewsDaily.com is prohibited.
About the Author
devteam
Steven A Feinberg (@CPAsteve) of Appletree Business Services LLC, is a PASBA member accountant located in Londonderry, New Hampshire.
See all blogsLatest Articles
By John Gittelsohn August 24, 2020, 4:00 AM PDT Some of the largest real estate investors are walking away from Read More...
Late-Stage Delinquencies are SurgingAug 21 2020, 11:59AM Like the report from Black Knight earlier today, the second quarter National Delinquency Survey from the Read More...
Published by the Federal Reserve Bank of San FranciscoIt was recently published by the Federal Reserve Bank of San Francisco, which is about as official as you can Read More...
Comments
Leave a Comment