
Blog

Nothing New in New Home Sales. Two Times!
The Census Bureau and Department of Housing and Urban Development havernreleased NewrnResidential Sales data for May 2011.</p
New Residential Sales data provides statistics on the sales of newrnprivately-owned single-family residential structures in the United States. Datarnincluded in the press release are (1) the number of new single-family housesrnsold; (2) the number of new single-family houses for sale; and (3) the medianrnand average sales prices of new homes sold. New residential sales estimates only include new single-family residentialrnstructures. Sales of multi-family units are excluded from these statistics.</p
Here is a Quick Recap from Reuters…</p<ul
</li
</li
</li
</li
 </p
</p
Sales of new single-family houses in May 2011 were at a seasonally adjusted annual rate of 319,000, according to estimates released jointlyrn today by the U.S. Census Bureau and the Department of Housing and Urbanrn Development. </p
This is 2.1 percent (±10.7%)* below the revised April rate of 326,000, but is 13.5 percent (±13.6%)* above the May 2010 estimate of 281,000.</p
 </p
</p
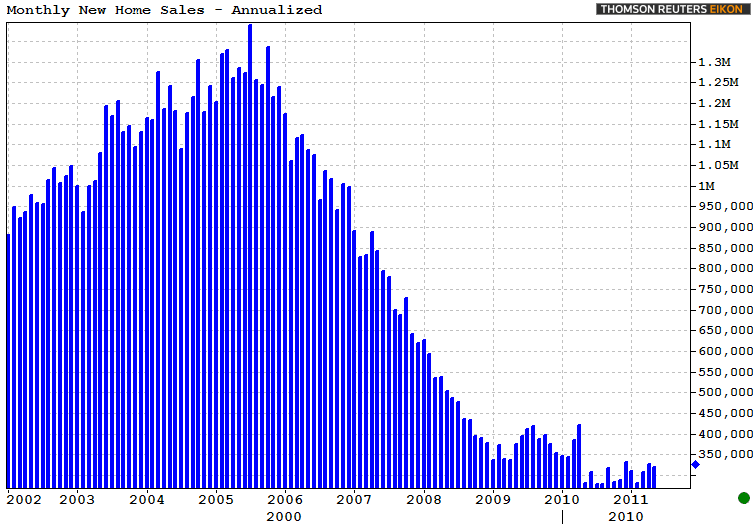
The median sales price of new houses sold in May 2011 was $222,600; the average sales price was $266,400. The seasonally adjusted estimate of new houses for sale at the end of May was 166,000. This represents a supply of 6.2 months at the current sales rate.</p
 </p
</p
Honestly I don’t know why we even cover this data anymore. It’s like we’re expecting to hear something different from the Commerce Department.</p
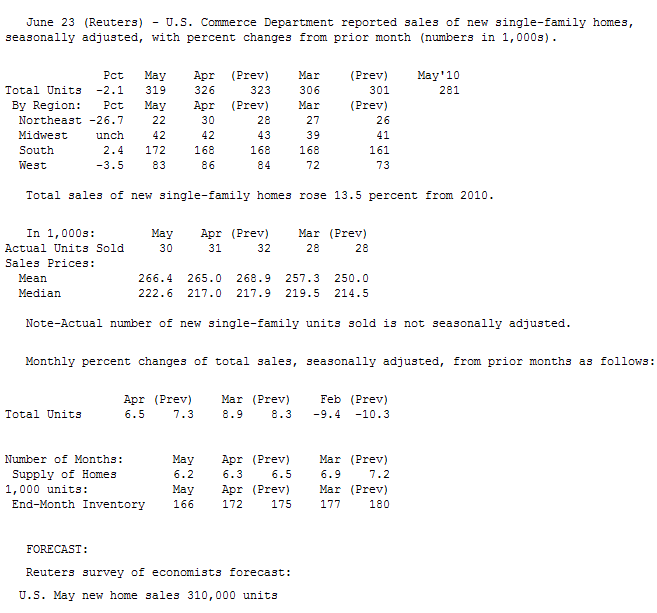
Do you see that blue histogram in the chart above? It estimates the amount of New Home Sales that will have occurred by the end of 2011 if sales continue at their current pace (Annualized). One thing you might notice about that histogram chart is its most recent additions look historically low in comparison to the housing boom of the mid-2000’s. While the current pace of annualized sales is indeed above the record low of 278,000 seen in August 2010, at 319,000 we’re not too far from the bottom! And we haven’t been since April 2010 either, when the annualized pace was 420,000 New Home Sales. Same story different month….</p
Here’s another fun fact if you’re not satisfied. The “(±10.7%)” and “(±13.6%)” seen in this part of the report: “This is 2.1 percent (±10.7%)* below the revised April rate of 326,000, but is 13.5 percent (±13.6%)* above the May 2010 estimate of 281,000”, represents the Standard Error of the survey results. When the Standard Error is bigger than the Commerce Department’s estimation, we would say the survey results are “Statistically Insignificant”. Meaning we don’t know if New Home Sales actually increased or decreased in May. The survey data is telling us NOTHING! A BETTER EXPLANATION</p
So on two accounts we learned nothing new about the residential construction market today. Well wait, there was one thing…</p
RTRS – NEWrnHOMES FOR SALE AT END OF MAY AT 166,000 UNITS. NEW RECORD LOW (PREVIOUS WAS APRIL 2011 AT 172,000 UNITS)</p
The new construction market has gone totally stagnate….</p
<i*A house is considered sold when either a sales contract has been signed or arndeposit accepted. Included in our estimates are houses for which arnsales contract is signed or deposit accepted before construction has actuallyrnstarted; for instance, houses sold from a model or from plans before any workrnhas started on the footings or foundations. These estimates also includernhouses sold while under construction or after completion. This surveyrndoes not follow through to the completion ("closing") of the salesrntransaction, so even if the transaction is not finalized, the house is stillrnconsidered sold. Preliminary new home sales figures are subject to revision duernto the survey methodology and definitions used. The survey is primarily basedrnon a sample of houses selected from building permits.
All Content Copyright © 2003 – 2009 Brown House Media, Inc. All Rights Reserved.nReproduction in any form without permission of MortgageNewsDaily.com is prohibited.
About the Author
devteam
Steven A Feinberg (@CPAsteve) of Appletree Business Services LLC, is a PASBA member accountant located in Londonderry, New Hampshire.
See all blogsLatest Articles
By John Gittelsohn August 24, 2020, 4:00 AM PDT Some of the largest real estate investors are walking away from Read More...
Late-Stage Delinquencies are SurgingAug 21 2020, 11:59AM Like the report from Black Knight earlier today, the second quarter National Delinquency Survey from the Read More...
Published by the Federal Reserve Bank of San FranciscoIt was recently published by the Federal Reserve Bank of San Francisco, which is about as official as you can Read More...
Comments
Leave a Comment