
Blog

RadarLogic: "Signs Point to Trouble Ahead" as Seasonal Home Price Peak Passes
Last week RadarLogic, a real estate data and analyticsrncompany, submitted a proposal, which we covered here, tornthe Federal Housing Finance Agency (FHFA) in response to a Request forrnInformation regarding the proposed bulk sale of government owned real estatern(REO). Wednesday, in their RPX Monthly Housing Market Report, they provided the latestrninformation on their RPX Composite Price, and used updated data to restate andrndemonstrate the need for and urgency of their plan. </p
In brief, the company suggested that a bulk sale wouldrninvolve huge discounts that would benefit investors but exacerbate losses tornthe government sponsored enterprises (GSEs) and FHA and ultimately taxpayersrnand put negative pressure on home prices and demand that would have a dominorneffect on appraisals and future home prices. rnInstead it suggested a two prong approach; aggressively modifyingrndistressed mortgages in the foreclosure pipeline and packaging the resulting excessrndebt into securities to be sold to investors willing to bet on future increasesrnin property values. Second, it advocatesrnthe government retain existing and future REO and turn day to day management ofrnthe properties over to professional management companies as rentalrnproperties. Both approaches, the companyrnsaid, would return stability to the market and thus to the economy andrndramatically reduce the cost of the recovery to both government and taxpayers. </p
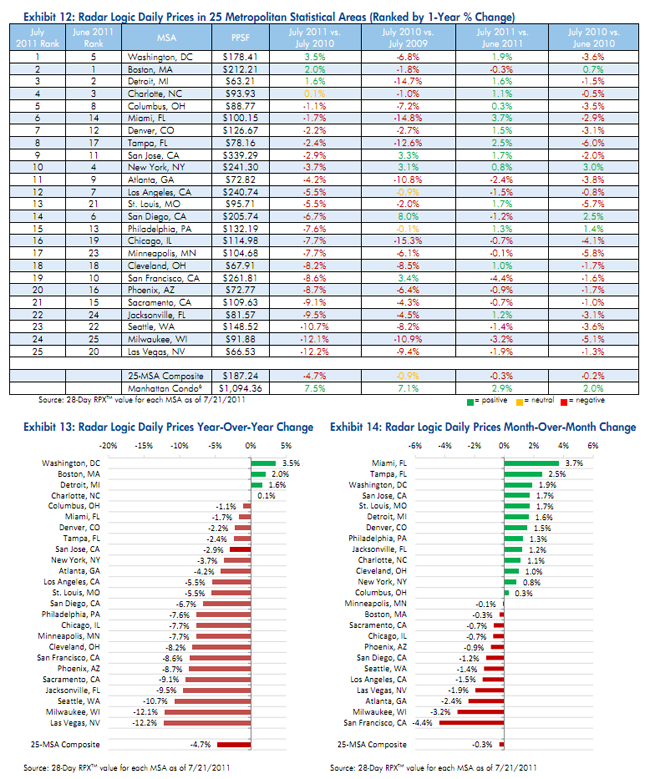
The RPX report</bcompiles statistics from the company's composite price index for residentialrnproperties in 25 metropolitan statistical areas (25-MSA RPX). The July 25-MSA RPX price was $187.24 perrnsquare foot (psf), a drop of 0.9 percent from the June value and 4.7 percentrnfrom the value in July 2010. The companyrnsaid that, with five months left in the year and the peak selling season behindrnus, it appears that the high price for 2011 was reached in June at 188.11, onlyrnslightly above $183.99, the lowest value observed in 2010, on December 31. In late 2007 the composite price reached $270rnpsf.</p
There is a great deal of variability in the pricesrnacross the 25 metropolitan areas. rnCleveland and Detroit are both in the $65 range while San Jose,rnCalifornia has a psf price of $240.74. rnThe company tracks Manhattan condos as a separate category and found thatrnprice, at $1,094.36 psf, had increased 7.5 percent since July 2010. </p
Only 20 percent of the MSAs in the index hadrnyear-over-year RPX price increases and the largest of these increases, inrnWashington, DC, was 3.5 percent. Three had decreases in double digits, Seattlern(-10.7 percent), Milwaukee (-12.1 percent), and Las Vegas (-12.2 percent.) Thirteen MSA’s logged month-over-monthrnincreases, the largest being 3.7 percent in Miami and 2.5 percent inrnTampa. The highest monthly losses werernrecorded in San Francisco (-4.4 percent) and Milwaukee (-3.2 percent).</p
The 25-MSA RPX transaction count increased 8.1 percentrnyear over year, but “this growth reflects subdued sales closings in July 2010rndue to the expiration of the homebuyer tax credit.” The transaction count increased 0.4 percentrnin July compared to the previous month.</p
While RadarLogic discounts the importance of thernyear-over-year transaction activity because of the anomaly of the tax creditrnexpiration, Cleveland, Ohio did see a 98 percent increase and Jacksonville,rnFlorida a 78.2 percent jump. Detroit’srnactivity level fell 19.1 percent. ElevenrnMSAs had increases in transaction activity from June to July with St. Louis,rnMissouri being notable with a 27.9 percent jump. San Diego (-7.5 percent), Tampa (-7.4rnpercent) and San Francisco (-6.5 percent) had the largest decreases. </p
The report shows little optimism for the future ofrnhousing. The RPX Forward Price Fixingsrnare established each day by dealer poll and represent the midmarket expectationrnof the reference value to be published on the contract expiration date. RPX is projecting little growth in this indexrnover the next four years. From therncurrent level in the high $180s, the fixings remain virtually level through thernend of 2015, finishing the chart at just under $200. The cumulative Home Price Appreciationrnimplied by these composite forward fixings at each years’ end are:</p
2011 – 1.5 percent</p
2012 – 2.0 percent</p
2013 – 2.5 percent</p
2014 – 3.1 percent</p
2015 – 3.6 percent </p
Radar Logic said it was predictingrnthat the next 10- and 20-City S&P/Case-Shiller composite indices willrnincrease about one percent month-over-month but will remain about 3 percent belowrnthe July 2010 level. The 10-City index,rnit says, will come in at about 156 and the 20-City at roughly 143. </p
Returning to promoting its proposalrnto FHFA, the Company restates its concern that foreclosures, bank inventories,rnand taxpayer losses are going to continue to grow while prices suffer furtherrndeclines. The total of REO properties held by all parties – GSEs, FHA, privaternlenders – at the end of Q2 2011 was 548,000, a number that has declined overrnthe past few quarters as lenders slowed or stopped foreclosures in the wake ofrnthe robo-signing controversy. OnrnSeptember 20, a witness at a Senate Banking Committee hearing estimated thatrn10.4 million additional borrowers – or one in five mortgagors in the country – arernlikely to default on their mortgages. “Thisrnis a tidal wave headed straight toward REO inventories and ultimately thernnation’s housing markets,” the Report says.</p
 </p
</p
All Content Copyright © 2003 – 2009 Brown House Media, Inc. All Rights Reserved.nReproduction in any form without permission of MortgageNewsDaily.com is prohibited.
About the Author
devteam
Steven A Feinberg (@CPAsteve) of Appletree Business Services LLC, is a PASBA member accountant located in Londonderry, New Hampshire.
See all blogsLatest Articles
By John Gittelsohn August 24, 2020, 4:00 AM PDT Some of the largest real estate investors are walking away from Read More...
Late-Stage Delinquencies are SurgingAug 21 2020, 11:59AM Like the report from Black Knight earlier today, the second quarter National Delinquency Survey from the Read More...
Published by the Federal Reserve Bank of San FranciscoIt was recently published by the Federal Reserve Bank of San Francisco, which is about as official as you can Read More...
Comments
Leave a Comment