Blog

REITs, Pension Plans Increase Multifamily Debt Holdings
Commercial and multi-family mortgagerndebt increased by $24.5 billion in the second quarter of 2013, with $10.9rnbillion of that being debt in the multi-family sector. The Mortgage Bankers Association (MBA) saidrnthe increase in debt from quarter to quarter was 1.0 percent for all mortgage debtrnand 1.3 percent for multi-family. Thernaggregate outstanding commercial and multifamily debt at the end of the secondrnquarter was $2.45 trillion; the multifamily portion was $875 billion. </p
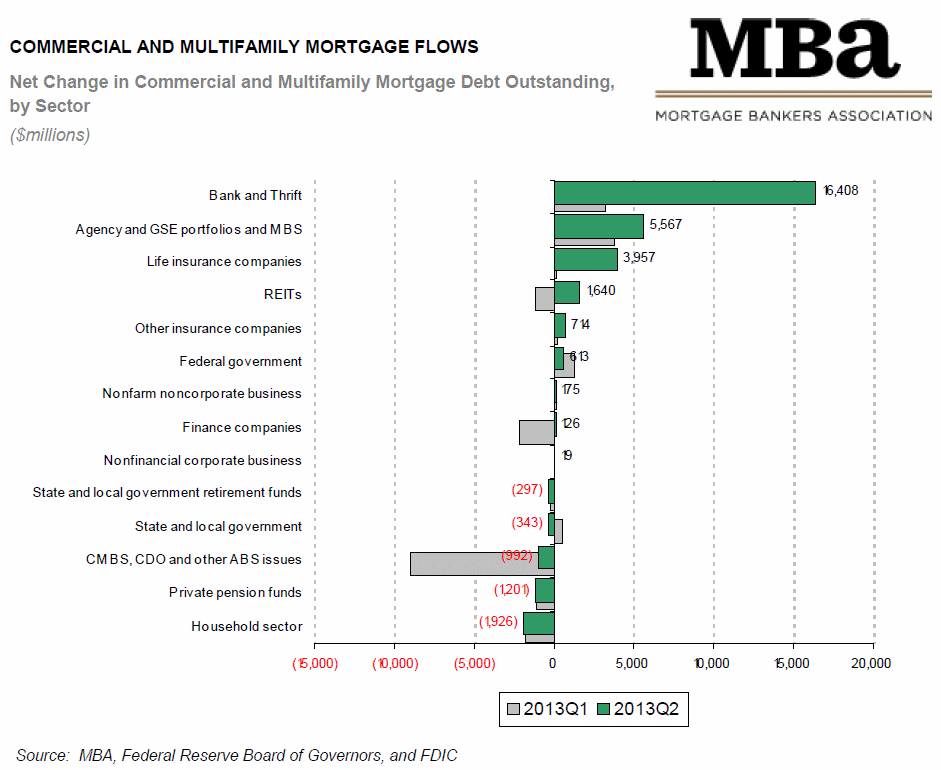
MBA’s Vice President of Commercial RealrnEstate Research, Jamie Woodwell, said of the numbers, “Arnstrong appetite among investors to put their money to work in commercial andrnmultifamily mortgages led to an increase in the level of mortgage debt outstanding.rnIn the second quarter alone, banks increased their holdings of commercial andrnmultifamily mortgages by $16 billion; Fannie Mae, Freddie Mac and FHA increasedrntheir multifamily holdings and guarantees by $5.6 billion and life insurancerncompanies increased their commercial and multifamily holdings by $4.0 billion.”</p
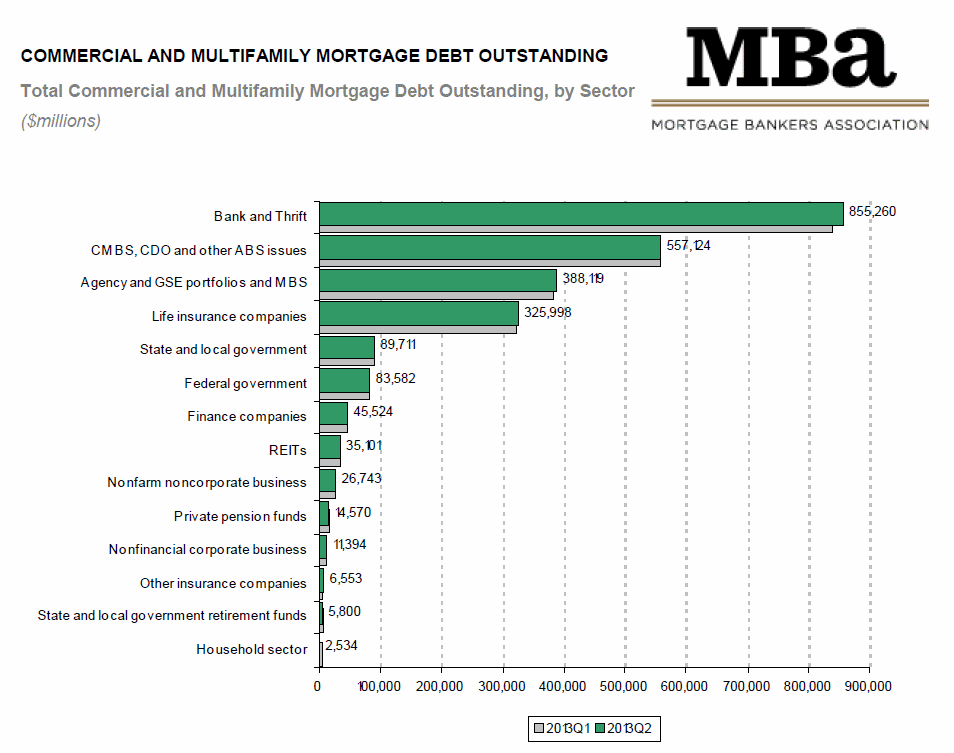
The largest holders ofrnaggregate debt were banks and thrifts at $855.3 billion or 34.5 percent followedrnby the category of Commercial Mortgage Backed Securities (CMBS), CollateralizedrnDebt Obligations (CDOs) and other asset-based securities (ABS) with $557.1rnbillion or 23.0 percent. Agency and GSErnportfolios and mortgage backed securities (MBS) were third with holdings of $388.1rnbillion in aggregate debt or 15.9 percent, most of which, $366.1 billion, was multifamilyrndebt which made that category of investors the largest in the mortgage sectorrnwith 44.4 percent. </p
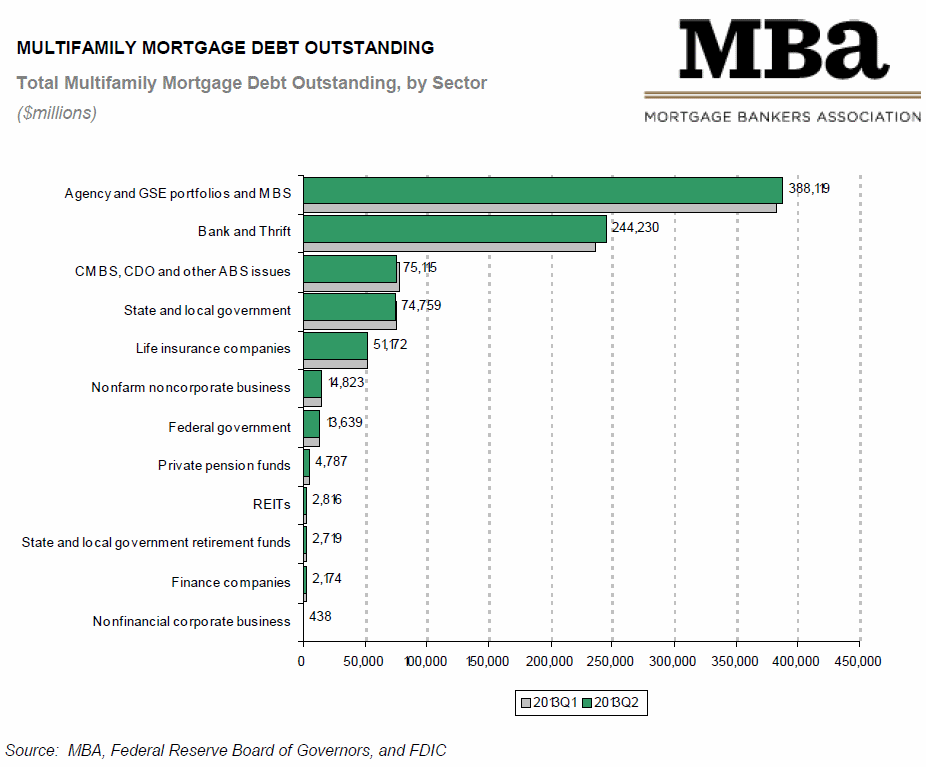
Banks and thrifts were thernsecond largest holders of multifamily debt at $244.2 billion or 27.4 percent. CMBS/CDO/ABS were third at $75.1 billion orrn8.6 percent followed closely by state and local governments with $74.8 billionrnor 8.5 percent. Other holders of morernthan 1 percent of the outstanding multifamily debt in the second quarter werernlife insurance companies (5.8 percent), nonfarm non corporate business (1.7rnpercent) and the Federal government (1.6 percent.)</p
 </p
</p
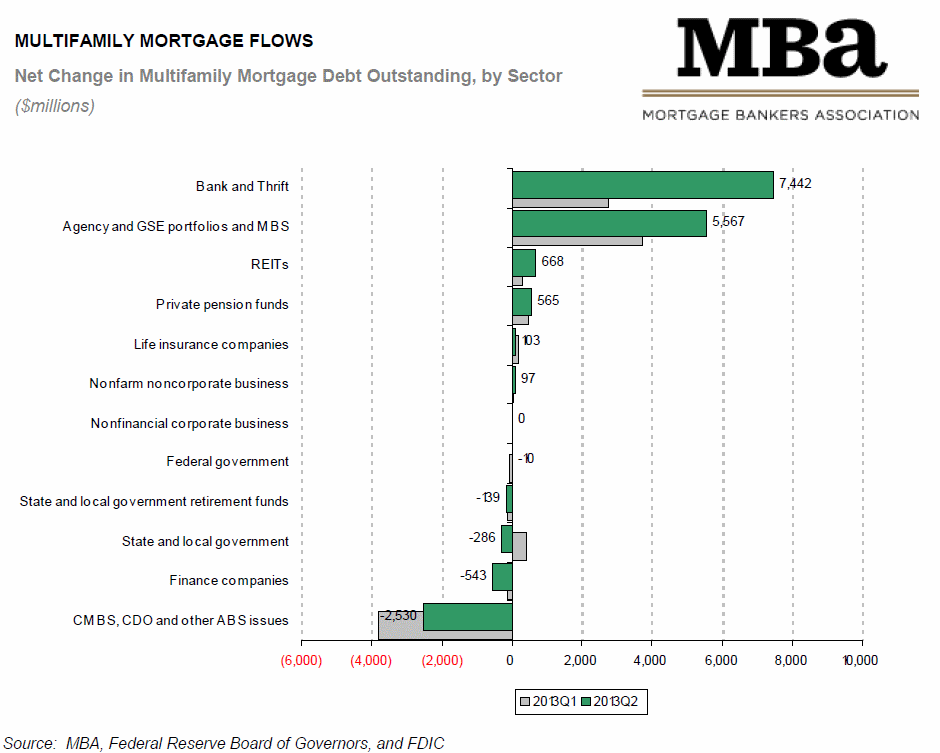
Agency/GSE portfolio and MBS holdings increased from the first quarter ofrn2013 to the second by 5.57 billion or 1.5 percent and banks and thriftsrnincreased by 7.4 billion or 3.1 percent. rnThe largest relative increase in holdings was a 31.1 percent increasern($668 million) by Real Estate Investment Trusts (REITS) and 13.4 percent growthrnin the portfolios of private pension funds to a total of $4.8 billion. State and local governments dropped theirrnmultifamily investment by $2.5 billion or -3.3 percent. The largest relative divestiture was byrnfinance companies which lowered their holdings by 20 percent, from $2.7 billionrnto $2.2 billion. </p
 </p
</p
Following banks and thriftsrnand the CMBS/CDO/ABS and Agency/GSE/MBS sectors, other large holders of overallrncommercial and mortgage debt were life insurance companies ($325.0 billion orrn13.3 percent), State and local governments ($89.7 billion, 3.7 percent), and thernFederal Government ($83.6 billion or 3.4 percent.) Finance companies, REITS, and nonfarm, non-corporaternbusinesses each held between 1 and 2 percent of the total debt. </p
 </p
</p
The largest increases in overallrncommercial and multifamily debt were insurance companies other than life insurancerncompanies with a 12.2 percent increase to $6.6 billion. The household sector had a 43.2 percent droprnin holdings from $4.5 billion to $2.5 billion.</p
 </p
</p
MBA’s analysisrnsummarizes the holdings of loans or, if the loans are securitized, the form ofrnthe security. For example, many life insurance companies invest both in wholernloans for which they hold the mortgage note (and which appear in this datarnunder Life Insurance Companies) and in commercial mortgage-backed securitiesrn(CMBS), collateralized debt obligations (CDOs) and other asset backedrnsecurities (ABS) for which the security issuers and trustees hold the note (andrnwhich appear here under CMBS, CDO and other ABS issues).</p
MBA’s analysis isrnbased on data from the Federal Reserve Board’s Flow of Funds Account of thernUnited States and the Federal Deposit Insurance Corporation’s Quarterly BankingrnProfile. More information on the construction of this data series is containedrnin Appendix A in the report.
All Content Copyright © 2003 – 2009 Brown House Media, Inc. All Rights Reserved.nReproduction in any form without permission of MortgageNewsDaily.com is prohibited.
Latest Articles
By John Gittelsohn August 24, 2020, 4:00 AM PDT Some of the largest real estate investors are walking away from Read More...
Late-Stage Delinquencies are SurgingAug 21 2020, 11:59AM Like the report from Black Knight earlier today, the second quarter National Delinquency Survey from the Read More...
Published by the Federal Reserve Bank of San FranciscoIt was recently published by the Federal Reserve Bank of San Francisco, which is about as official as you can Read More...

Comments
Leave a Comment