
Blog

Report Spotlights Impact of Commodity Boom on Home Prices
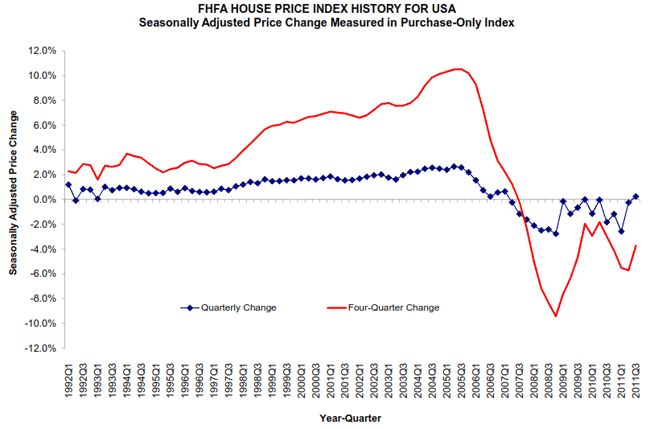
The Federal Housing Finance Agency’srnseasonally adjusted purchase only price index (HPI) shows that U.S. housernprices rose slightly in the third quarter of 2011. The HPI is calculated from data on home salesrnobtained from Freddie Mac and Fannie Mae acquired purchase money mortgagesrnwhere previous mortgages were also held by one of the government sponsoredrnenterprise (GSE). In addition to itsrnusual analysis of home price data, the report looks at the effects of supplementaryrninformation added to the analysis last quarter and at the impact of thernincrease in the prices of and demand for certain commodities in recentrnyears. </p
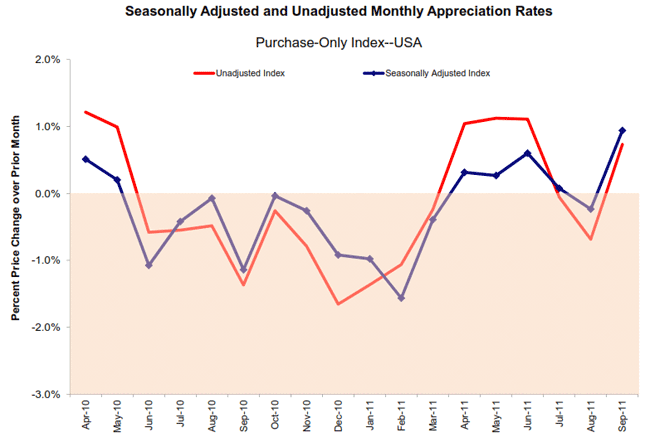
Home prices rose 0.2 percent on a seasonallyrnadjusted basis from prices in the second quarter. On an unadjusted basis prices were up 0.7rnpercent. Prices in the third quarterrnwere 3.7 percent lower than in the third quarter of 2011. The index which tracks monthly prices showedrnan increase of 0.9 percent on a seasonally adjusted basis from August tornSeptember and 0.7 percent on an unadjusted basis.</p
 </p
</p
Month-to-month, prices rose to varyingrndegrees in eight of the nine census divisions. rnOnly the East South Central division lost ground during September, arnslight 0.2 percent decline. Increases inrnmost of the census divisions were under 1 percent but the East North Centralrndivision had a 1.5 percent increase and the West North Central division a 2.5rnpercent jump. The quarterly indexrndeclined in 21 states and the District of Columbia.</p
FHFA Principal Economist Andrew Leventis</bsaid, "In most regions of the country, third-quarter home values werernrelatively stable, even in some areas that experienced sharp price declines inrnpreceding quarters. While most housingrnmarkets still face stiff headwinds, the fact that some beleaguered states -rnsuch as Idaho, Florida, and Utah – saw quarterly price increases is a positiverndevelopment."</p
The -3.7 percent price change in the nationalrnpurchase-only index since the third quarter of 2010, when combined with the 4.8rnpercent increase in the price of other goods and services over that period, resultsrnin an inflation-adjusted price of homes that is down approximately 8.1 percentrnover the last year.</p
FHFA also produces an all-transactionsrnindex which combines purchase data with data from GSE acquired mortgages usedrnfor refinancing. This index was up 0.9rnpercent quarter-over-quarter but down 4.3 percent on an annual basis.</p
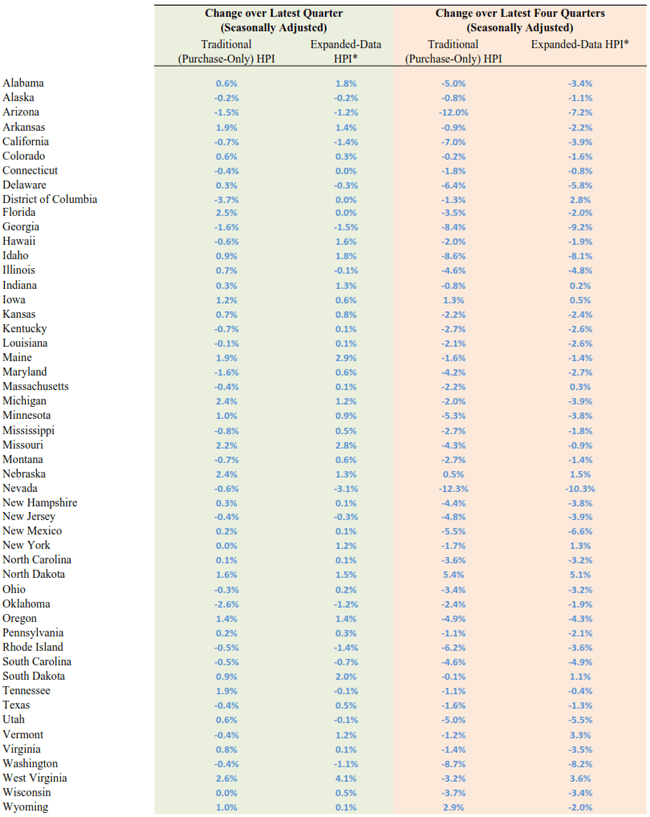
Beginningrnin the second quarter of 2011, FHFA published an “expanded data” HPI whichrnsupplements GSE mortgage data with information from FHA endorsed loans and withrncounty recorder information. To thernextent that differences exist, it is hoped that the expanded data will betterrnreflect price trends for houses not financed by the GSEs.</p
Asrnthe table shows, both the original and the expanded index posted a 0.2 percentrnchange between the second and third quarters of 2011. However, over the last four quarters, the twornmeasures diverge somewhat; the expanded index measure evidences a slightly lessrnsevere decline of 2.9 percent instead of the 3.7 percent drop in the purchasernonly index.</p
 </p
</p
Therndifferences for individual states is more pronounced but tends to be lessrndramatic over the four-quarter time period which may indicate that some of therndifference between the two indexes is the result of statistical noise fromrnsampling variation.</p
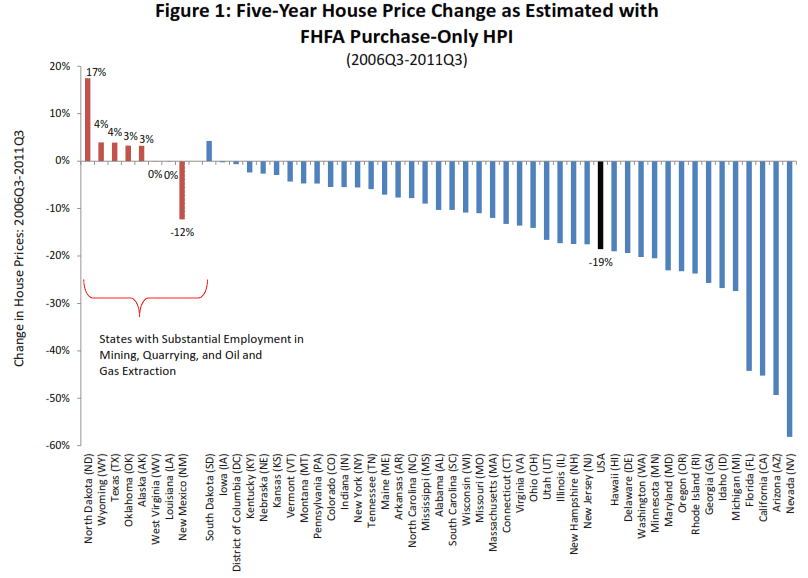
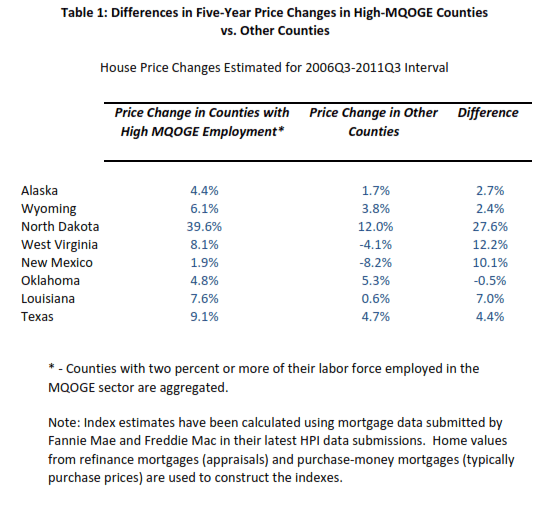
The reportrnnotes that the housing bust of the last five years coincided with a boom inrncommodities prices, especially oil and petroleum products but also coal,rnprecious metals, copper, and agricultural products. While this boom has negatively affected muchrnof the country, some areas have benefitted from the price increases and, inrnareas that are net producers of these goods, the commodity price increases havernworked to offset the effects of the housing bust. In fact, in some such states the increases inrnemployment and income have driven up housing prices.</p
FHFA did arnspecial analysis of the rise in commodity prices by identifying states wherernmore than 2 percent of the population is employed in “mining, quarrying, andrnoil and gas extraction (the MQOGE Sector). rnEight states, Alaska, Wyoming, North Dakota, West Virginia, New Mexico,rnOklahoma, Louisiana, and Texas were identified as MQOGE sector states.</p
 </p
</p
The tablernabove compared five-year house price changes for the eight high MQOGE statesrnagainst price changes in the other states using FHFA’s purchase-only housernprice index. The average five yearrndecline for the nation as a whole was 19 percent while the price changes forrnhigh MQOGE states ranged from -12 in New Mexico, the only state with a negativernchange, and +17 percent in North Dakota. rn While this is interesting it isrnnot definitive as rural states in general have fared better during the housingrnbust and the eight high-MQOGE states are relatively rural so the observedrnphenomenon might be a function of their rural nature. However, when thesernstates are examined on the county level, the difference between housing pricernchanges in counties with high MQOGE employment and those without, the positive impactrnof the employment becomes more apparent.</p
All Content Copyright © 2003 – 2009 Brown House Media, Inc. All Rights Reserved.nReproduction in any form without permission of MortgageNewsDaily.com is prohibited.
About the Author
devteam
Steven A Feinberg (@CPAsteve) of Appletree Business Services LLC, is a PASBA member accountant located in Londonderry, New Hampshire.
See all blogsLatest Articles
By John Gittelsohn August 24, 2020, 4:00 AM PDT Some of the largest real estate investors are walking away from Read More...
Late-Stage Delinquencies are SurgingAug 21 2020, 11:59AM Like the report from Black Knight earlier today, the second quarter National Delinquency Survey from the Read More...
Published by the Federal Reserve Bank of San FranciscoIt was recently published by the Federal Reserve Bank of San Francisco, which is about as official as you can Read More...
Comments
Leave a Comment