
Blog

S&P/Case-Shiller: Home Price Double-Dip Looms
Standard and Poors released October S&P/Case-Shiller Home Price Indices this morning.
The S&P/Case-Shiller Home Price Indices are constructed to accurately track the price path of typical single-family homes located in each metropolitan area provided. Each index combines matched price pairs for thousands of individual houses from the available universe of arms-length sales data. The indices have a base value of 100 in January 2000; thus, for example, a current index value of 150 translates to a 50% appreciation rate since January 2000 for a typical home located within the subject market.</p
Last month David M. Blitzer, Chairman of the Index Committee at Standard & Poor’s, got a little more bearish on the outlook for housing after September home price data took another step in the wrong direction. He said, “Another weak report; weaker than last month. The national index is down 1.5% from the third quarter of last year and 15 of 20 cities are down over the last 12 months. Other than Tampa, FL, there are no new lows this month but many analysts will argue that a double dip will be confirmed before Spring.“</p
The latest report indicated the 20-city home price index fell 1.3% in October vs. calls for a 0.6% month to month decline vs. the previous MoM read of -0.8% (yes this data is two months behind). Year over year, the 20-city index fell 0.8% in October vs. median estimates for a 0.1% decline. This is the first time since January 2010 that the YoY read has turned negative.</p
FYI: This is the non-seasonally adjusted data. S&P says we should focus on that: READ MORE</p
 </p
</p
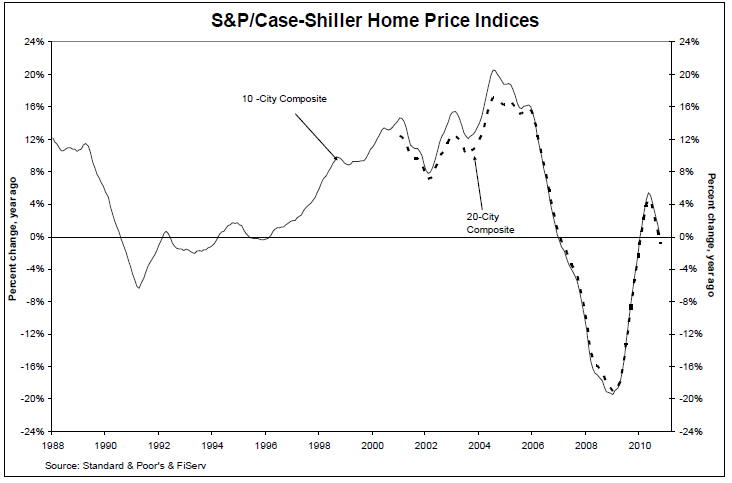
The chart above depicts the annual returns of the 10-City and the 20-City Composite Home Price Indices. In October 2010, the 10-City and 20-City Composites recorded annual returns of +0.2% and -0.8% ,respectively. October was the fifth consecutive month where the annual growth rates moderated from their prior month’s pace, confirming a clear deceleration in home price returns. The 10-City Composite posted a +0.2% annual growth rate in October, versus the +5.4% reported five months prior in May, and the 20-City Composite has now reentered negative territory, down 0.8% in October versus its +4.6% May print.</p
David Blitzer said this about October data, “The double-dip is almost here, as six cities set new lows for the period since the 2006 peaks. There is no good news in October’s report. Home prices across the country continue to fall.” </p
Wait, there’s more….</p
“The trends we have seen over the past few months have not changed. The tax incentives are over and the national economy remained lackluster in October, the month covered by these data. Existing homes sales and housing starts have been reported for both October and November, and neither is giving any sense of optimism. On a year-over-year basis, sales are down more than 25% and the months’ supply of unsold homes is about 50% above where it was during the same months of last year. Housing starts are still hovering near 30-year lows. While delinquency rates might have seen some recent improvement, it is only on a relative basis. They are still well above their historic averages, in both the prime and sub-prime markets.”</p
And more….</p
“Looking at the monthly statistics, all 20 MSAs and both Composites were down in October over September. While not always consecutive months, twelve of the MSAs and both composites have posted at least six months of decline since the beginning of 2010. In addition 15 MSAs and both composites have posted three consecutive months of decline with October’s report; a further sign that the few months of positive print earlier this spring were only a temporary boost. The seasonally adjusted data tell largely the same story.”</p
 </p
</p
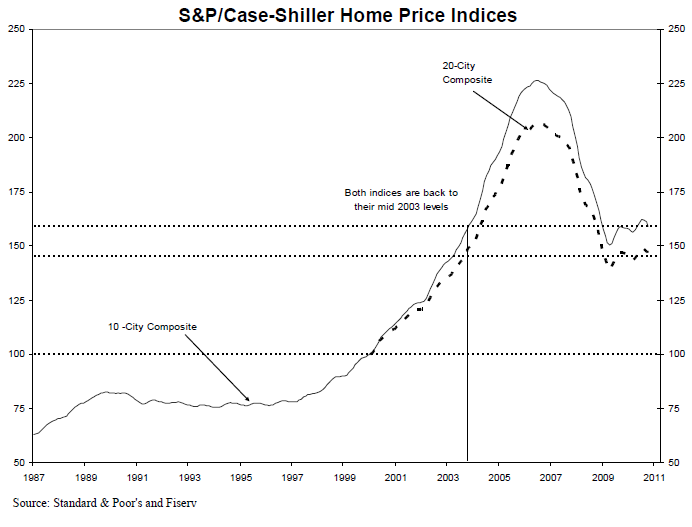
The chart above shows the index levels for the 10-City and 20-City Composite Indices. As of October 2010, average home prices across the United States are back to the levels where they were in mid 2003. Measured from June/July 2006 through October 2010, the peak-to-current declines for the 10-City Composite and 20-City Composite are -29.7% and -29.6%, respectively. The improvements from their April 2009 trough are +5.7% and +4.4%, respectively.</p
Plain and Simple: David Blitzer summed up the October data with this statement, “The double-dip is almost here, as six cities set new lows for the period since the 2006 peaks. There is no good news in October’s report. Home prices across thern country continue to fall.”</p
Of course every market is different so not all neighborhoods are feeling the same downward price pressures, but the overall theme is apparent. Check out this story: Appraisal Hell: What’s a Home Worth These Days?
All Content Copyright © 2003 – 2009 Brown House Media, Inc. All Rights Reserved.nReproduction in any form without permission of MortgageNewsDaily.com is prohibited.
About the Author
devteam
Steven A Feinberg (@CPAsteve) of Appletree Business Services LLC, is a PASBA member accountant located in Londonderry, New Hampshire.
See all blogsLatest Articles
By John Gittelsohn August 24, 2020, 4:00 AM PDT Some of the largest real estate investors are walking away from Read More...
Late-Stage Delinquencies are SurgingAug 21 2020, 11:59AM Like the report from Black Knight earlier today, the second quarter National Delinquency Survey from the Read More...
Published by the Federal Reserve Bank of San FranciscoIt was recently published by the Federal Reserve Bank of San Francisco, which is about as official as you can Read More...
Comments
Leave a Comment