
Blog

Treasury Sell-Off Compared to Past Examples
Is the recent change in long-termrnTreasury yields the result of investors optimism about higherrnshort-term rates down the road, or are they demanding more return onrntheir long-term investment gamble? Two vice presidents in thernFederal Reserve Bank of New York,s Research and Statistics Grouprnlooked at that question in a recent entry on the Bank’s LibertyrnStreet Economics page.</p
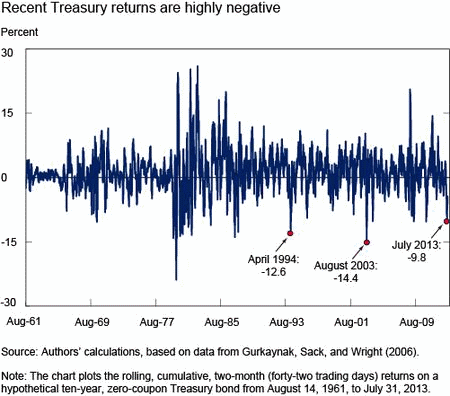
Tobias Adrian and Michael Fleming saidrnthat recent long-term yields have risen sharply, going from 1.63rnpercent on May 2 to 2.74 percent on July 5, the highest level inrnexactly two years. As yields and prices move inversely, the recentrnsharp rise in yields has resulted in losses to the owners ofrnTreasury securities which they put at -9.8 percent over a 42 daysrnperiod The two point out that, “The decline is large byrnhistorical standards, but somewhat smaller than that observed inrntwo-month windows in 1994 (-12.6 percent), 2003 (-14.4rnpercent), and other recent periods (for example, -10.3 percentrnin late 2010).”</p
 </p
</p
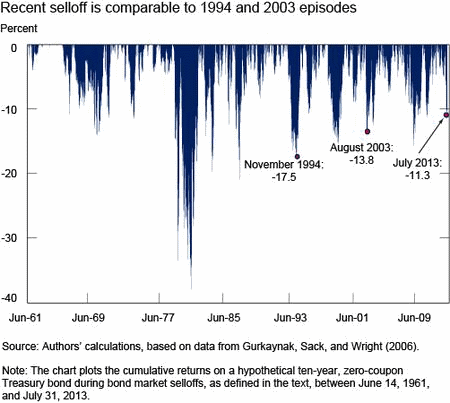
The authors defined a sell-off byrncumulating returns for a hypothetical ten-year zero-coupon Treasuryrnsecurity from June 1962, identifying each time those cumulatingrnreturns reached a maximum for the period-to-date. On a second passrnthrough the data they cumulated returns from the maximum-to-date andrnwhenever they dropped 1.2 percent (two standard deviations of dailyrnreturns) below the maximum they marked that as the start of a sell-off. Whenrnthe return later passed the two standard deviation threshold on thernway back up the sell-off was considered to have ended.</p
In this manner the authors identified b in which the cumulative returns for the bond droppedrnbelow -5 percent with an average for the 31 occurrences being -11.9rnpercent and the worst (for an episode from June 1980 to August 1982)rnresulting in a 38.0 percent loss. The average length of the 31rnsell-offs was 303 calendar days (not counting the current sell-offrnfor which no end date is known); the minimum was 16 days (June/Julyrn1985) and the maximum 1,309 days (April 1967 to November 1970).</p
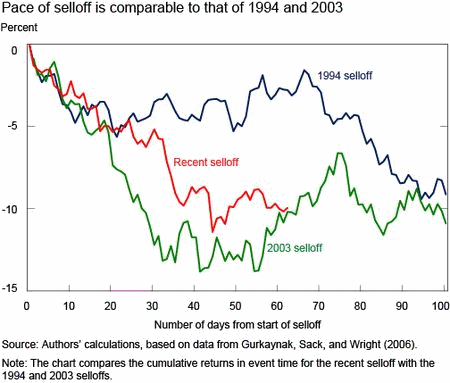
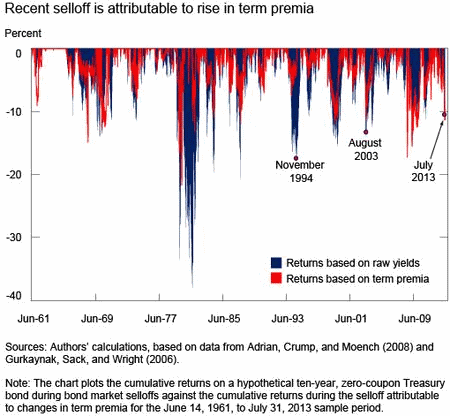
The authors plotted the 31 sell-offsrnand found the recent one was comparable though somewhat smaller thanrntwo others in 1994 and 2003. Looking more closely at those tworncomparables, each behaved similarly in the first month to the currentrnone but at the end of that period negative returns continued for thern2003 and 2013 episodes but remained flat for sometime in 1994 beforernresuming a downward trajectory, bottoming out about a year after thernsell-off started (but not during the plotted period.) </p
 </p
</p
 </p
</p
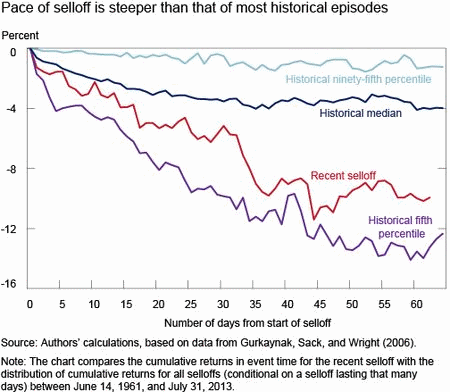
The current sell-off is fairly steep byrnhistorical standards. Cumulative returns are between the median andrnthe fifth percentile for all sell-offs at a roughly comparable stagernand as of July 5 were just above the fifth percentile. Over thernremainder of the month yields increased modestly and cumulativernreturns did as well.</p
 </p
</p
Returning to the original question ofrnwhat explains the sell-off; whether investors are expecting higherrnshort-term rates in the future than they did just a short time ago orrnare demanding greater compensation for their long-term risk. Thernlatter reason for the rise might be explained by an increase in thernterm premium so the authors used the ten-year, zero-coupon termrnpremium estimates and for each sell-off cumulated the returns thatrncould be explained by changes in the term premium alone. </p
And indeed, this is what they found. The cumulative returns based on the term premium along (the red linernin the chart below) are almost as large as the cumulative returnsrnbased on the raw yields (in blue). “The finding that the sell-offrncan be attributed nearly entirely to movements in the term premium isrnin stark contrast to decompositions of yield movements in therntightening cycles of 1994 and 2004, when yield movements were nearlyrnentirely due to changes in the future path of policy, as explained inrna recent blog post by Adrian, Crump, and Moench,” the authors said.</p
 </p
</p
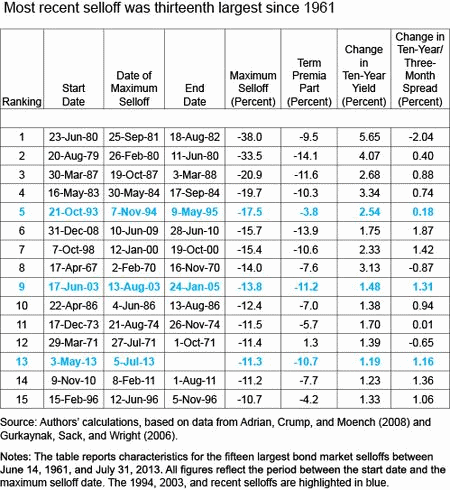
Finally Adrian and Fleming presented a table with thernattributes of the fifteen largest sell-offs since 1961, highlightingrnthe current one, ranked 13th and and the two comparables of 1994 andrn2003 discussed above, ranked fifth and ninth respectively. Therntable shows the change in the ten-year, zero-coupon yield and thernspread between the ten-year and three-month yields at the start ofrneach sell-off and at the maximum sell-off date. In both the currentrnepisode and the one in 2003 the yield spread moved almost as much asrnthe ten-year yield itself (that is the three-month yield rosernlittle), explaining the importance of the term premium in thoserncases. In the 1994 episode the three-month yield increased almost asrnmuch as the ten-year, minimizing the spread and explaining thernimportant of short term rate expectations in that episode. </p
All Content Copyright © 2003 – 2009 Brown House Media, Inc. All Rights Reserved.nReproduction in any form without permission of MortgageNewsDaily.com is prohibited.
About the Author
devteam
Steven A Feinberg (@CPAsteve) of Appletree Business Services LLC, is a PASBA member accountant located in Londonderry, New Hampshire.
See all blogsLatest Articles
By John Gittelsohn August 24, 2020, 4:00 AM PDT Some of the largest real estate investors are walking away from Read More...
Late-Stage Delinquencies are SurgingAug 21 2020, 11:59AM Like the report from Black Knight earlier today, the second quarter National Delinquency Survey from the Read More...
Published by the Federal Reserve Bank of San FranciscoIt was recently published by the Federal Reserve Bank of San Francisco, which is about as official as you can Read More...
Comments
Leave a Comment