Blog

Two Generations will Determine Housing's Future
In the second partrnof the Harvard Joint Center for Housing Studies’ latest update on The State of the Nation’s Housing, thernauthors look at the nation’s demographics and how they currently affect housingrnand will do so in upcoming years. </p
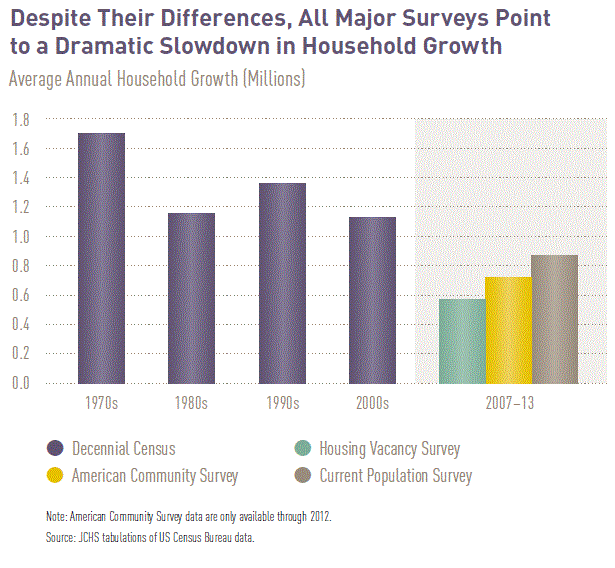
This Center’srnreport, as many other housing students, points to the sluggish pace ofrnhousehold growth which has languished in the 600,000 to 800,000 range forrnseveral years. This is well behind previousrndecades when the average has been over 1 million. Much of this can be attributed to youngerrnadults who because of the economy have continued to live with their parents,rncontinue their education, or share housing with friends. The report extrapolates that there may be 1.1rnmillion fewer households among persons in their 20s than history would predict.</p
 </p
</p
These potentialrnhouseholds may represent a pent-up demand that will be released when therneconomy improves further there could be a strong boost to the housing marketrnwhen the leading edge of the millennial generation (born between 1985 and 2004)rnmoves into the age group where household formation normally peaks. When thernleading edge of the baby boom was of similar age in the 1970s householdrnformation averaged 1.7 million units per year for the entire decade.</p
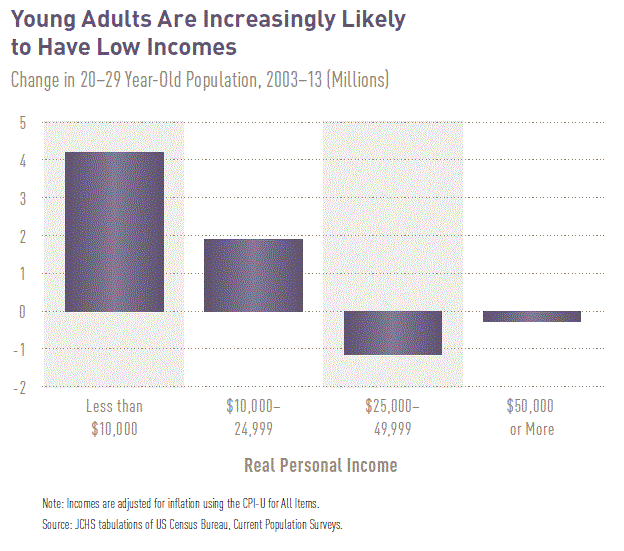
Higher personalrnincome is also strongly associated with household formation and while headshiprnrates across income groups have been fairly constant over the past 10 years,rngrowth in each group has not. Millionsrnof young adults joined the ranks of the lower-income population from 2003 torn2013 and this shift accounts for more than half of the drop in householdrnformations among 20-29 year old adults over that period. The combination of these factors meant thatrnsome 2.5 million more adults in their 20s and a half million more adults in thern30s lived with their parents in 2013 than if 2003 household formation rates forrnthese age groups had continued.</p
 </p
</p
Millennials didrnform millions of independent households over the past five years and because ofrnthe size of this generation the number of households they head is actuallyrnhigher than a decade earlier. Given thatrnheadship rate typically rise sharply for adults in their 20s and early 30s, thernnumbers of Millennials forming households should rise significantly ifrnbelatedly in the coming years. Howeverrnstronger income and employment growth is necessary to drive this change andrnthis group is on a lower trajectory of housing independence that earlierrngenerations. Given the current pace ofrneconomic growth it is hard to predict how soon they will finally be able tornlive on their own.</p
Net immigrationrndeclined considerably during the Great Recession. The Current Population Survey indicates thatrnthe number of foreign-born households actually fell in 2009 and 2010. Despite a drop in their inflow and householdrnformation rates, immigrants still account for a substantial share of householdrnformation in the U.S. and have been a major source of population growth,rncontributing about 25 percent of total growth in the 1990s and 35 percent inrnthe 2000s. It was immigration that limited what could have been a sharprndrop-off in housing demand that was expected to follow the baby-boomrngeneration.</p
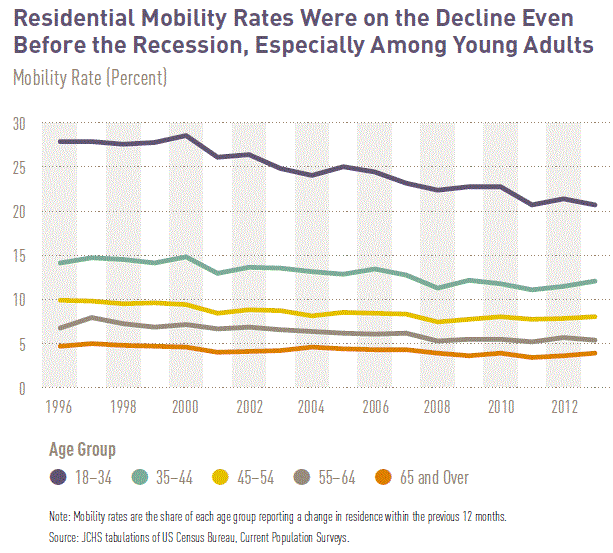
Domestic mobility isrnanother important factor in housing. Residentialrnmoves spur investments in home improvements and furnishings, generate incomernfor real estate agents and lenders, and expand housing options for others but domesticrnmobility has been trending down since the 1990s. The share of adults who moved over the priorrnyear fell from 16 percent in 1996 to just over 11 percent in 2013. This reflects the transition of baby boomersrninto age groups less likely to move and lower mobility among young adults whornare the most likely to move. Millennialsrnand gen-Xers are both tending to be less footloose than their predecessors.</p
 </p
</p
The renterrnpopulation is a little more mobile. During 2007-2013 a slightly smaller sharernof renters had lived in the same unit less than two years and a slightly largerrnshare had lived there between two and four years. The share of renters in the same unit forrnfive or more units was unchanged. </p
The housing marketrnitself was responsible for a noticeable drop in mobility rates amongrnhomeowners. The steep drop in housernprices with the associated explosion in underwater mortgages, weak laborrnmarkets and limited access to credit all made it harder for owners to sell orrntrade up. The American Community Surveyrnfound that share of owners who had lived in their homes less than five yearsrndropped from 30 percent in 2007 to 21 percent in 2012 while those in theirrnhomes for 10 or more years increased from 49 percent to 57 percent. The report finds this remarkable in therncontext of millions losing their homes to foreclosure.</p
Reduced residentialrnmobility has diminished gains and losses across metro areas. In the midst of the housing boom in 2005rndomestic migration was responsible for 30 percent of population growth in thern20 fastest-growing metro areas, a share that dropped to 11 percent in 2013. Thernreduced mobility also stemmed outflows from metros that had been losingrnpopulations. The top five metros with positivernnet in-migration in 2005 added 320,000 people while the five with the highestrnpositive net in 2013 added only170,000. rnNet outflow in the top five cities that were losing population in 2005rnwas 640,000; in 2013 the top five lost only 240,000 residents. </p
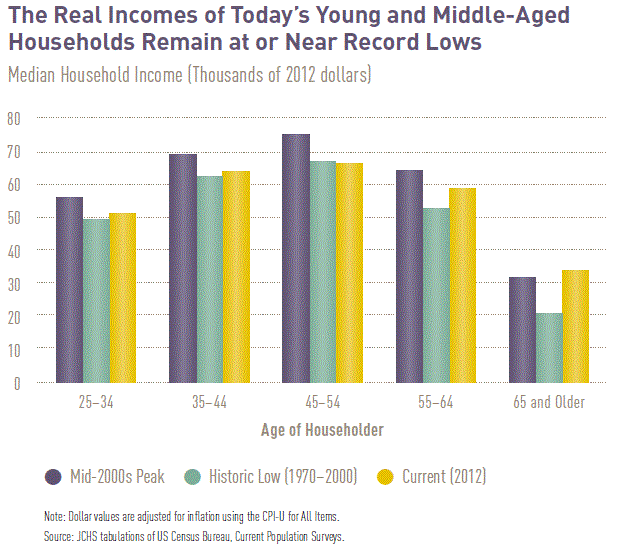
Median householdrnincome fell another 1.4 percent in real terms in 2012, to its lowest level inrnnearly two decades and the median incomes of younger and middle-aged adults arernat the lowest in records dating back to 1970. rnThe median income for households aged 25-34 fell an astounding 11 percentrnbetween 2002 and 2012, leaving their real incomes below those of the same agerngroup in 1972. </p
 </p
</p
The incomernsituation in minority households in this age group is even worse. The median income among minorities in 2012 wasrn$20,000 below that of a same-aged white household. The Center said two reasons for the lowrnincomes of young households in general is the widening gap between white andrnminority income and that the minority share of the population is growing. </p
Meanwhile thernunemployment rate for this younger group jumped from 4.7 percent in 2006-07 torn10.1 percent in 2010 and was still at 7.4 percent in 2013. Employment in this group is essentially atrnearly 1980s levels.</p
Households in theirrnpre-retirement years also saw real income drop. rnIn 2012 the median for households aged 50-64 dropped to $60,000, arnmid-1990s level although homeowners in that age group fared better, their incomesrnfell just 5 percent. Many households inrntheir 50’s and hoping to retire are in particular trouble. Real median incomes have fallen $9,100 amongrn50-54 year olds and $5,700 among 55-59 year olds since 2002.</p
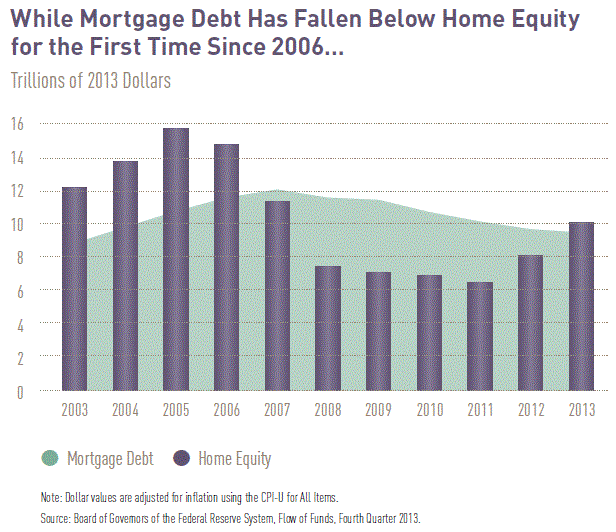
A continuedrnreduction of mortgage debt (by 2 percent in 2013) along with higher home pricesrnlifted real home equity by 24 percent to $10 trillion, more than aggregaternmortgage debt. But consumer debt was uprn14 percent from the end of 2010 to the end of 2013, accounting for 26 percentrnof aggregate household debt, the highest share since 2004. There is concern that the combination ofrnfalling income and rising debt may be weakening housing demand.</p
 </p
</p
Much of the debt isrneducation loans which have jumped 50 percent in the last four years and morernthan quadrupled over the past decade to $1.1 trillion. It accounts for 63 percent of the growth inrntotal debt over the past year and for nearly the entire increase in non-housingrnconsumer debt since 2003. </p
This soaringrnstudent debt may play a role in the lagging household formation andrnhomeownership rates among younger adults. rnIn 2010 39 percent of households aged 25-34 had student debt compared torn26 percent in 2001 and about half the current share in 1989. Young renters allocate more of their incomernto student debt payments; a median of 6 percent in 2010 among those under agern30 which may limit their ability to save, particularly for a downpayment on arnhome. Additionally, default rates on student loans are rising at an alarmingrnrate and this may ultimately limit the credit standing of young adults andrntheir ability to obtain a mortgage.</p
ThernJoint Center projects that demographic forces alone will drive household growthrnof 11.6 to 13.2 million between 2015 and 2025. rnBehind their projections are two trends which together will shift thernage composition of US households and thus housing demand. In the short run the aging of baby boomersrnwill increase the number of households age 70 and older by about 8.3rnmillion. The cohort of those aged 60-69rnwill rise by 3.5 million adding to the aging of the population.</p
Arn2012 survey showed that 78 percent of householders over age 65 intend to remainrnin their homes. Over time many of thesernhomes will require retrofitting to accommodate aging in place and there will berna greater need for neighborhood services to accommodate homeowners’ inabilityrnto drive. When the oldest populationrnreaches age 85 in 2031 they will increasingly seek alternative situationsrnoffering in-house services such as assisted or group living.</p
Thernsecond factor, the aging of the millennial generation, will increase the numberrnof households in their 30s by 2.4-3.0 million in the next decade but these numbers vastly understate their impact on housing demand. They will account for most of the newrnhouseholds, some 24 million new households between 2014 and 2025, driving uprndemand for rentals and starter homes.</p
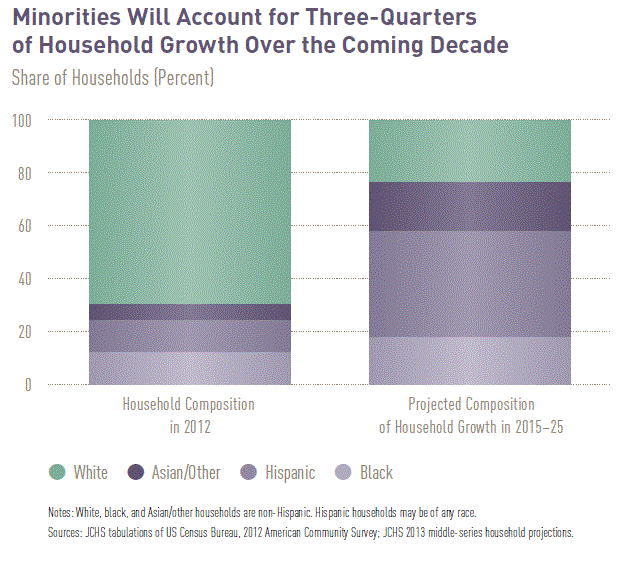
Millennialsrnare much more diverse than previous generations and will increase the racialrnand ethnic diversity of U.S. households, magnified by large losses of olderrnwhite households. By 2025 dissolutionsrnof boomer households aged 50-69 will reach 3.0 million and those of their precedingrngeneration 10.0 million. As a resultrnminorities will drive 76 percent of net household growth in the next 10 years.</p
 </p<p
</p<p
All Content Copyright © 2003 – 2009 Brown House Media, Inc. All Rights Reserved.nReproduction in any form without permission of MortgageNewsDaily.com is prohibited.
Latest Articles
By John Gittelsohn August 24, 2020, 4:00 AM PDT Some of the largest real estate investors are walking away from Read More...
Late-Stage Delinquencies are SurgingAug 21 2020, 11:59AM Like the report from Black Knight earlier today, the second quarter National Delinquency Survey from the Read More...
Published by the Federal Reserve Bank of San FranciscoIt was recently published by the Federal Reserve Bank of San Francisco, which is about as official as you can Read More...

Comments
Leave a Comment