
Blog

Home Prices Increase at Fastest Annual Pace Since May 2006- Case Shiller
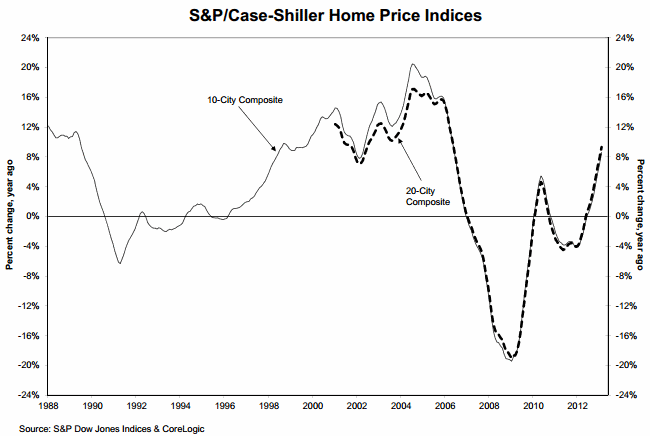
Every city in the S&P Case-Shiller 20-City Composite Index has now posted annual increasesrnfor at least two consecutive months. ThernFebruary 2013 indices released this morning showed year-over-year prices in thern10-City Composite gained 8.6 percent and the 20-City Composite rose 9.3 percent.rn In 16 of the 20 cities the annualrngrowth rate rose in February compared to January and ten are now posting doublerndigit positive changes. </p
 </p
</p
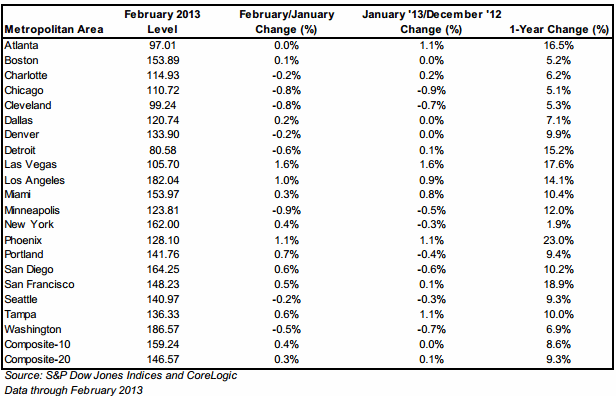
The 10-City Composite increased 0.4 percent fromrnJanuary to February and the 20-City increased 0.3 percent with Las Vegas andrnPhoenix posting monthly increases in excess of 1 percent. Prices in all 20 cities increased on arnseasonally adjusted basis with Phoenix jumping 1.8 percent and Minneapolis 1.3rnpercent. Eight cities had small monthly declines</bon a non-seasonally adjusted basis, the largest ironically being Minneapolis atrn-0.9 percent. </p
David M. Blitzer, Chairman of the Index Committee atrnS&P Dow Jones Indices said all 20 cities continue to show solid increasesrnin home prices. “The 10- and 20-CityrnComposites recorded their highest annual growth rates since May 2006;rnseasonally adjusted monthly data show all 20 cities saw higher prices for twornmonths in a row – the last time that happened was in early 2005. </p
“Phoenix, San Francisco, Las Vegas, and Atlanta werernthe four cities with the highest year-over-year price increases. Atlanta recovered from a wave of foreclosuresrnin 2012 while the other three were among the hardest hit in the housingrncollapse. At the other end of thernrankings, three older cities – New York, Boston, and Chicago – saw the smallestrnyear-over-year price improvements,” Blitzer said.</p
Home prices for both city composites are back tornautumn 2003 levels. Measured from theirrnJune/July 2006 peaks each of the composites show a decline of approximately 29-30rnpercent while the 10-City has recovered from its early 2012 low by 8.7 percentrnand the 20-City recovery is 9.3 percent. </p
 </p
</p
Blitzer said the despite the mixed economic news inrnMarch, “housing continues to be one of the brighter spots in the economy. The 2013 first quarter GDP report shows thatrnresidential investment accelerated from the 2012 fourth quarter and made a positiverncontribution to growth. One openrnquestion is the mix of single family and apartments; housing data show a largerrnthan usual share is apartments.”</p
The S&P Home Price Indices are constructed torntrack the price path of a typical single-family home located in each of thernmetropolitan areas tracked. Each indexrncombines matched price pairs for thousands of individual houses fromrnarmed-length sales data. The indicesrnhave a base value of 100 in January 2000 so a house with an index value of 150rnhas had a 50 percent increase in value since that data.
All Content Copyright © 2003 – 2009 Brown House Media, Inc. All Rights Reserved.nReproduction in any form without permission of MortgageNewsDaily.com is prohibited.
About the Author
devteam
Steven A Feinberg (@CPAsteve) of Appletree Business Services LLC, is a PASBA member accountant located in Londonderry, New Hampshire.
See all blogsLatest Articles
By John Gittelsohn August 24, 2020, 4:00 AM PDT Some of the largest real estate investors are walking away from Read More...
Late-Stage Delinquencies are SurgingAug 21 2020, 11:59AM Like the report from Black Knight earlier today, the second quarter National Delinquency Survey from the Read More...
Published by the Federal Reserve Bank of San FranciscoIt was recently published by the Federal Reserve Bank of San Francisco, which is about as official as you can Read More...
Comments
Leave a Comment