
Blog

Housing Bubble or Recession? You Might Have to Pick One
There are two conflicting theories on how or even ifrnmonetary policy should play a role in stabilizing asset price booms andrnbusts. If central banks use interestrnrate hikes sufficient to curb leverage and curb booms it might also boostrnunemployment and lower inflation, deviating from the central bank’s goals ofrnfull employment and price stability. Thernalternative is to concentrate on those dual goals and allow financialrnregulation and supervision to deal separately with threats to financialrnstability. </p
A new Economic Letter, Interest Rates and House Prices: Pillrnor Poison? from the Federal Reserve Bank of San Franciscornand written by Òscar Jordà, vice presidentrnin the banks Economic Research Department, Moritz Schularick, and Alan M.rnTaylor professors of economics at thernUniversity of Bonn and the University of California, Davis respectivelyrnlooks at the link between interestrnrates, mortgage lending, and house prices.</p
Quantifying thisrnlink, the authors say, is important in assessing whether or not interest raternpolicy can be used to guard against leveraged asset price booms. The largest role in such booms is played byrnhousing because those purchases are typically leveraged through mortgages. In other words, can another housing bubble be prevented by raising mortgage rates?</p
The housing bubble ofrn2002-2006 is generally considered a major trigger of the ensuing financial crisisrnbut economists disagree about the degree to which interest rates may havernfueled it. The authors conclude that interest rates would have needed anrnincrease of 8 percentage points to completely control the boom-bust cycle. Such an increase however could have causedrnsignificant damage to the Fed’s twin objectives of full employment and pricernstability. </p
The key to curbing a price boom whilernminimizing other damage is how responsive housing demand is to interest rates. However, directly measuring this responsivenessrnis very difficult because it reflects the interaction of supply and demandrnrather than just one or the other. Thisrninteraction complicates analysis and illustrates that correlation is notrncausation. However some historical eventsrncan be used as experiments to properly identify the responsiveness, orrnelasticity, of demand.</p
Two earlier authors described an interestingrninternational financing paradox. If arncountry “pegs” its exchange rate – fixing it with another country – and allowsrncapital to flow freely across its borders, then it cannot also control interestrnrates. The peg removes exchange raternrisk and investors would immediately take advantage of any difference inrninterest rates between the countries. This is sometimes called the trilemma</iof international finance, since a country cannot have free movement of capital,rna fixed exchange rate, and an independent monetary policy at the same time.</p
By looking at eras of pegged exchangernrates dating back to 1870 covering 16 advanced economies or around 90% of thernindustrialized world during periods when countries have moved in and out ofrnexchange rate pegs the authors could identify periods when interest ratesrnfluctuated independently of conditions such as unemployment and inflation thatrnthe central bank normally uses to measure consistency with mandated goals. Examplesrninclude gold standard eras, traditional exchange rate mechanisms such asrnBretton Woods between 1945 and 1971, and, more recently in Europe, the euro. </p
However, as the dominant economy, otherrncountries tend to peg their exchange rates to the U.S. and it has seldom handedrnover the reins of monetary policy, with the exception of the 1879 to 1913 goldrnstandard period. Therefor the authors’ researchrnon the elasticity of mortgage lending and house prices to interest ratesrnprimarily reflects an average value calculated across countries other than thernUnited States. They say, however, their resultsrnare valid to the extent that the shared experience of the industrialized world</balso applies to the United States.</p
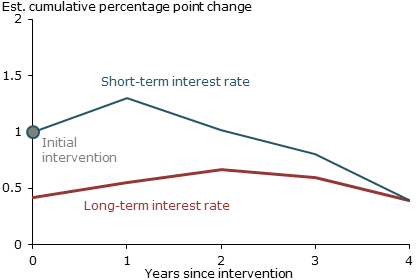
The authors assumed a 1 percentagernpoint increase to the short term interest rate as a stand-in for the policyrnrate in year 1 (Figure 1) and then traced the cumulative response of rates forrna five-year government riskless security. rnAs anticipated by the literature the long-term rates did not respondrnone-to-one to short-terms rates, only about half of the short-term fluctuationsrnpassed through to the long-term rate.</p
 </p
</p
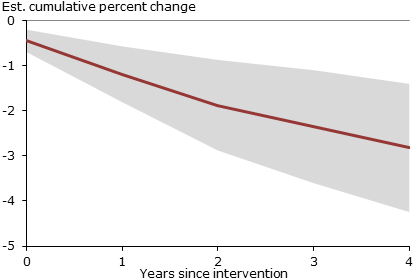
The behavior of the long-term rate is a<bproxy for mortgages rates for which the authors did not have data and Figure 2rntraces the cumulative response of mortgage lending to their increase. While the impact is initially quite muted,rnover time lending shrinks, declining about 2.8 percentage points over fourrnyears (measured as a ratio to GDP). </p
 </p
</p
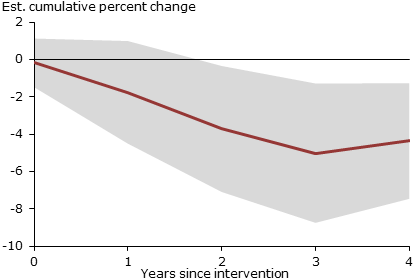
Not surprisingly, house prices (Figurern3) suffer a similar fate. House prices (ratio of change to per capita income) fall,rnslowly at first, but by the fourth year the accumulated decline is about 4.4rnpercent.</p
 </p
</p
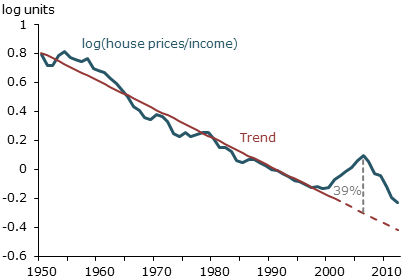
So how much would interest rates havernneeded to increase to keep housing prices in check during the 2002-06 housingrnbubble? Figure 4 displays post-World WarrnII ratio of house prices to income stated in log terms; changes can be readrnapproximately as percentage changes. The ratio had declined steadily until 2002rnand the authors extrapolated the 1950-2002 trend out through 2006. They then calculated the percent differencernbetween actual observed house prices and this trend to be about 40 percent,rnsimilar to what would result from a comparison of house prices to the consumerrnprice index and close to the price boom experienced in the United Kingdom. </p
 </p
</p
Since a 1 percentage point increase inrnthe short rate translates into about a 4.4 percent decline in house prices, thernauthors calculated that keeping house prices on trend would have required aboutrnan 8 percentage point increase in the federal funds rate in 2002. Instead the rate stayed between 1 and 1.25rnpercent from the end of 2002 until the June 2004 when it rose 4.25 percentagernpoints, reaching 5.25 percent by June 2006. In the authors’ experiment, thernrate would have been about 8 percentage points higher at the end of 2002, butrnwould have ended at about the actual level of June 2006. Roughly speaking, such a large increase inrninterest rates would have depressed output more than did the Great Recession. </p
The authors caution with severalrncaveats to their results. First, the initial increase to the federal funds raterncould have been smaller; preventing the crisis might not have required returningrnhouse prices back to trend. Second, households might have eventually revisedrntheir expectations about the Fed’s new resolve against asset price booms, thusrnrequiring a smaller initial intervention. Third, even a fraction of that 8rnpercentage point increase would probably have sunk the economy into recession,rnslowing prices even more rapidly although at a cost of added unemployment. Thenrnthere is the inevitable uncertainty that surrounds any empirical analysis.</p
The authors conclude that slowing downrna housing boom is likely to require a considerable increase in interest rates,rnprobably one widely at odds with maintaining full employment and pricernstability and would also require the Fed have a crystal ball to foretell upcomingrnbooms. “In restraining asset prices, while the power of interest rate policy isrnuncontestable, its wisdom is debatable,” the authors say.
All Content Copyright © 2003 – 2009 Brown House Media, Inc. All Rights Reserved.nReproduction in any form without permission of MortgageNewsDaily.com is prohibited.
About the Author
devteam
Steven A Feinberg (@CPAsteve) of Appletree Business Services LLC, is a PASBA member accountant located in Londonderry, New Hampshire.
See all blogsLatest Articles
By John Gittelsohn August 24, 2020, 4:00 AM PDT Some of the largest real estate investors are walking away from Read More...
Late-Stage Delinquencies are SurgingAug 21 2020, 11:59AM Like the report from Black Knight earlier today, the second quarter National Delinquency Survey from the Read More...
Published by the Federal Reserve Bank of San FranciscoIt was recently published by the Federal Reserve Bank of San Francisco, which is about as official as you can Read More...
Comments
Leave a Comment