
Blog

35 Consecutive Months of Higher Home Prices, but No Bubble Fears
Thernpace of price increases continued virtually unchanged in March with greater year-over-yearrnappreciation in ten of the 20 cities tracked by S&P Dow Jones Indices thanrnin February. The National Home Price Indexrnwhich covers all nine U.S. Census Divisions slipped slightly with a 4.1 percentrnannual gain in March compared to 4.2 percent the previous month. The 10-City Composite Index was up 4.7rnpercent on an annual basis and the 20-City rose 5.0 percent, virtually the samernannual increases they posted in February. rn</p
SanrnFrancisco and Denver led in annual gains. rnSan Francisco’s 10.3 percent increase was its first in double digits sincernlast July and Denver was up 10.0 percent followed by Dallas at 9.3rnpercent. Among the ten cities reportingrnhigher appreciation in March than in February the largest differential was inrnTampa, up 1.4 percent. Cleveland had thernlargest deceleration, down 1.2 percent compared to the annual growth inrnFebruary.</p
Allrnthree indexes grew significantly on a month-over-month basis. The National Index rose 0.8 percent and the 10-Cityrnand 20-City Composites were up by 0.8 percent and 0.9 percent respectivelyrncompared to 5 percent for each in February. rnSan Francisco was again in first place with a jump of 3.0 percentrnfollowed by Seattle with a 2.3 percent gain. rnNew York was the only city to report a loss with a 0.1 percent declinernfor the month.</p
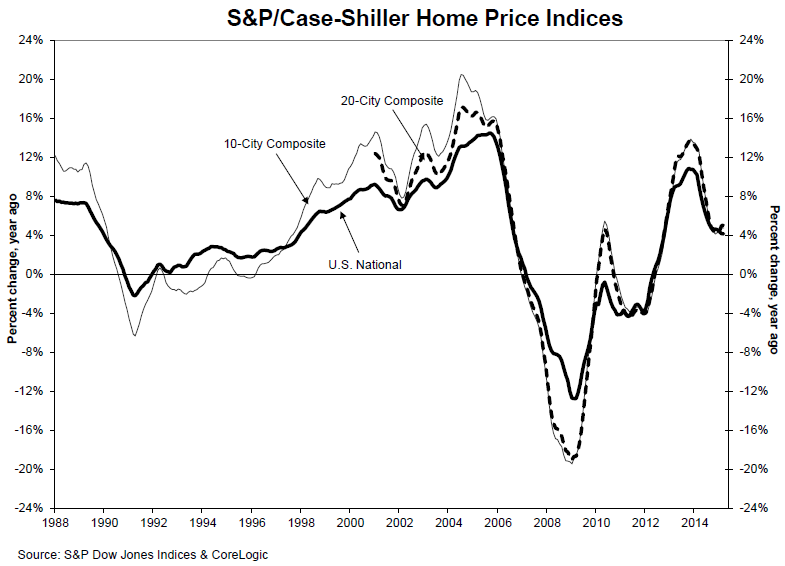
DavidrnM. Blitzer, Managing Director and Chairman of the S&P Dow Jones IndexrnCommittee said, “Home prices have enjoyed year-over-year gains for 35rnconsecutive months. The pattern of consistentrngains is national and seen across all 20 cities covered by thernS&P/Case-Shiller Home Price Indices. The longest run of gains is in Detroitrnat 45 months, the shortest is New York with 27 months. However, the pace has moderatedrnin the last year; from August 2013 to February 2014, the national index gainedrnmore than 10 percent year-over-year, compared to 4.1 percent in this release.</p
“Givenrnthe long stretch of strong reports, it is no surprise that people are asking ifrnwe’re in a new home price bubble. The only way you can be sure of a bubble is lookingrnback after it’s over. The average 12 month rise in inflation adjusted home pricesrnsince 1975 is about 1.0 percent per year compared to the current 4.1 percentrnpace, arguing for a bubble. However, the annual rate of increase halved in the lastrnyear, as shown in the first chart. Home prices are currently rising morernquickly than either per capita personal income (3.1 percent) or wages (2.2rnpercent), narrowing the pool of future home-buyers. All of this suggests thatrnsome future moderation in home prices gains is likely. Moreover, consumer debt levelsrnseem to be manageable. I would describe this as a rebound in home prices, not bubblernand not a reason to be fearful.”</p
 </p
</p
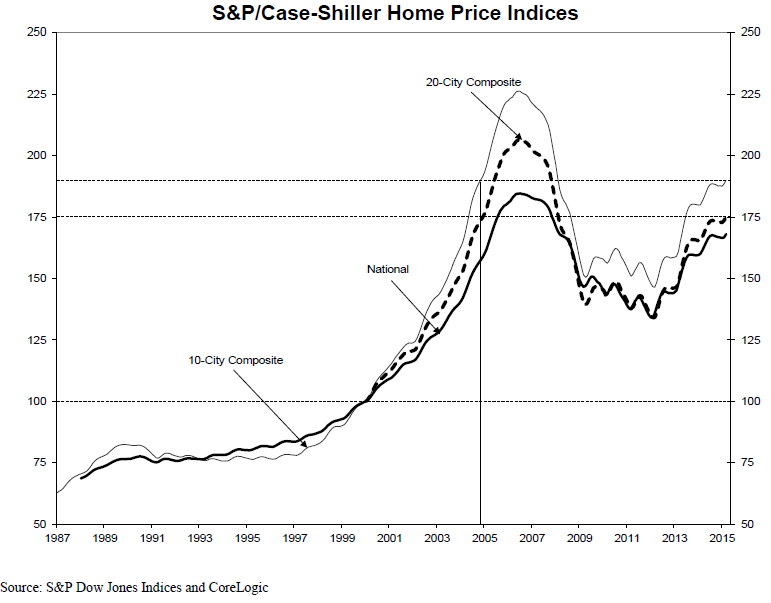
As of March 2015,rnaverage home prices for the MSAs within the 10-City and 20-City Composites are back to their autumn 2004 levels.rnMeasured from their June/July 2006 peaks, thernpeak-to-current decline for both Composites is approximately 15-16%.rnSince the March 2012 lows, the 10-City andrn20-City Composites have recovered 29.8% andrn30.7%.rn</p
 </p
</p
The S&P/Case-Shiller Home Price Indices are constructed to accurately track the price path of typical single-family homes located in eachrnmetropolitan area provided. Each index combines matched price pairs for thousands of individual houses fromrnthe available universe of arms-length sales data. The S&P/Case-Shiller National U.S. Home Price Index tracksrnthe value of single-family housing within the United States.rnThe index is a compositernof single-family home price indicesrnfor the nine U.S. Censusrndivisions. The indices have arnbase value of 100 in January 2000; thus, for example, a current index value ofrn150 translates to a 50% appreciationrnrate since January 2000 for a typical home located within the subject market.
All Content Copyright © 2003 – 2009 Brown House Media, Inc. All Rights Reserved.nReproduction in any form without permission of MortgageNewsDaily.com is prohibited.
About the Author
devteam
Steven A Feinberg (@CPAsteve) of Appletree Business Services LLC, is a PASBA member accountant located in Londonderry, New Hampshire.
See all blogsLatest Articles
By John Gittelsohn August 24, 2020, 4:00 AM PDT Some of the largest real estate investors are walking away from Read More...
Late-Stage Delinquencies are SurgingAug 21 2020, 11:59AM Like the report from Black Knight earlier today, the second quarter National Delinquency Survey from the Read More...
Published by the Federal Reserve Bank of San FranciscoIt was recently published by the Federal Reserve Bank of San Francisco, which is about as official as you can Read More...
Comments
Leave a Comment