
Blog

Case-Shiller Shows Home Prices Up 4.3% From Year Earlier
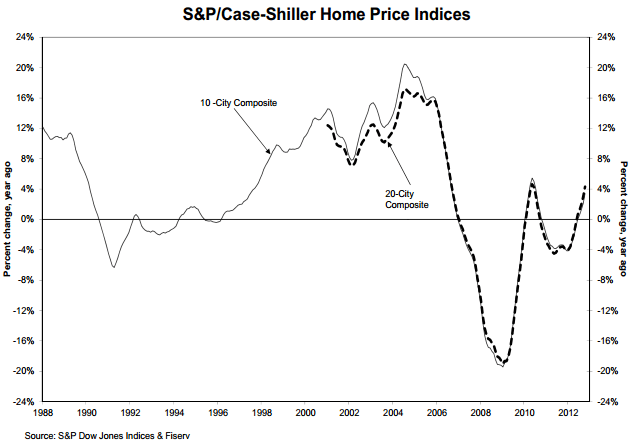
The S&P/Case-Shiller Home Price Indices (HPI)rnreleased this morning outstripped analysts expectations with strong increasesrnin home prices over the 12 months ending in October. Both the 20-City and the 10-City showedrnanticipated seasonal weaknesses in October itself, however and along with 12 ofrnthe 20 cities, posted a monthly price decrease. </p
The 10-City Composite Index was up 3.4 percent on anrnannual basis in October compared to 2.1 percent in September and the 20-CityrnComposite rose 4.3 percent compared to 3.0 percent. On a month-over-month basis both compositesrndeclined 0.1 percent. rnS&P/Case-Shiller presents most of its data on a non-seasonallyrnadjusted basis.</p
 </p
</p
In 19 of the 20 cities the annual increase in October wasrnhigher than that in September and only two cities, Chicago and New York, hadrnnegative annual returns. The recoveryrnseems well established in some markets; for example Phoenix home prices increased for the 13th consecutive month andrnSan Diego for the ninth. </p
David M. Blitzer, Chairman of thernIndex Committee at S&P Dow Jones Indices said, “The October monthly numbers were weaker than September as 12 cities saw prices drop compared to sevenrnthe month before. rnThe five which turned down in Octoberrnbut not in September, were Atlanta,rnDallas, Miami, Minneapolis and Seattle. Among all 20 cities, Chicago was the weakest with prices dropping 1.5%, followed by Boston wherernprices fell 1.4%. Las Vegasrnsaw the strongest one-month gain with prices up 2.8%.</p
“Annual rates of change in home prices are a better indicator of the performance of the housing market than the month-over-month changes,”rnBlitzer said, “because home pricesrntendrnto be lower in fall and winter than inrnspring and summer. Both the 10- and 20-City Compositesrnand 19 of 20 cities recordedrnhigher annual returnsrnin October 2012 than inrnSeptember. The impact of the seasons can also be seen in the seasonally adjustedrndata where only three cities declined month-to-month. The 10-City Compositernannual rate of +3.4% in October was lower than the 20-CityrnComposite annual figure of +4.3% becausernthe two weaker cities – Chicago and New York – have higherrnweights in the 10-City Composite.”</p
Blitzer said it is clear that thernhousing recovery is gathering strength. rnContinued annual price gains and the strong performances in both thernsouthwest and in California, both of which were strongly affected by thernhousing bust, “confirm that housing is now contributing to therneconomy. Last week’s final revisionrnto third quarter GDP growth showed that housing represented 10% of the growth while accounting for less than 3% of GDP.”</p
Even cities at the bottom arernshowing gains. Detroit had a 24.2rnpercent annual increase even though prices there are still about 20 percentrnlower than they were 12 years ago. Blitzerrnalso cited 22.5 percent and 22.1 percent increases in San Francisco and Phoenixrnfrom their recent lows and prices “comfortably higher” than 12 yearsrnago.</p
 </p
</p
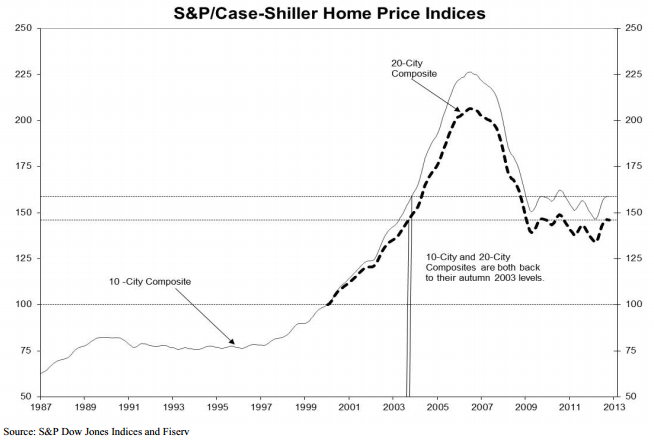
As of October average home pricesrnnationwide were back to autumn 2003 levels. Measured from their June/July 2006 peaks, the decline for both Composites is approximately 30% through October 2012 and approximately 35% from the June/July 2006 peak values to theirrnrecent lows in early 2012. The Octoberrn2012 levels for both Compositesrnare about 8.4 to 9% above their early 2012 lows.</p
In October 2012, 12 MSAs and both Compositesrnposted negative month-over-month returns. Detroit,rnLas Vegas, Los Angeles, Phoenix,rnPortland, San Diegornand San Francisco were the only citiesrnthat recorded positive monthly returns. Denverrnremained flat.</p
ThernS&P/Cash Shiller Home Price Index is a composite of single family home price indices for the nine U.S. Census divisionsrnand is calculated quarterly. The 10- and 20-City indices are weighted averages ofrnmetropolitan area indices. Each index has a base value of 100 in January 2000.
All Content Copyright © 2003 – 2009 Brown House Media, Inc. All Rights Reserved.nReproduction in any form without permission of MortgageNewsDaily.com is prohibited.
About the Author
devteam
Steven A Feinberg (@CPAsteve) of Appletree Business Services LLC, is a PASBA member accountant located in Londonderry, New Hampshire.
See all blogsLatest Articles
By John Gittelsohn August 24, 2020, 4:00 AM PDT Some of the largest real estate investors are walking away from Read More...
Late-Stage Delinquencies are SurgingAug 21 2020, 11:59AM Like the report from Black Knight earlier today, the second quarter National Delinquency Survey from the Read More...
Published by the Federal Reserve Bank of San FranciscoIt was recently published by the Federal Reserve Bank of San Francisco, which is about as official as you can Read More...
Comments
Leave a Comment