
Blog

Cash-outs Affecting Negative Equity Trends
Arnsecond company has now reported a recent increase in the number of underwater residentialrnproperties in the U.S. Last monthrnCorelogic said that approximately 172,000rnhomes slipped from positive to negative equity in the fourth quarter of 2014, arnchange the company called “seasonal.” rnToday RealtyTrac reported an increase in the first quarter of 2015 ofrn0.4 percent in the number of properties with negative equity, the firstrnincrease in nearly three years. Bothrnreports noted year-over-year declines in underwater properties for thernrespective quarters.</p
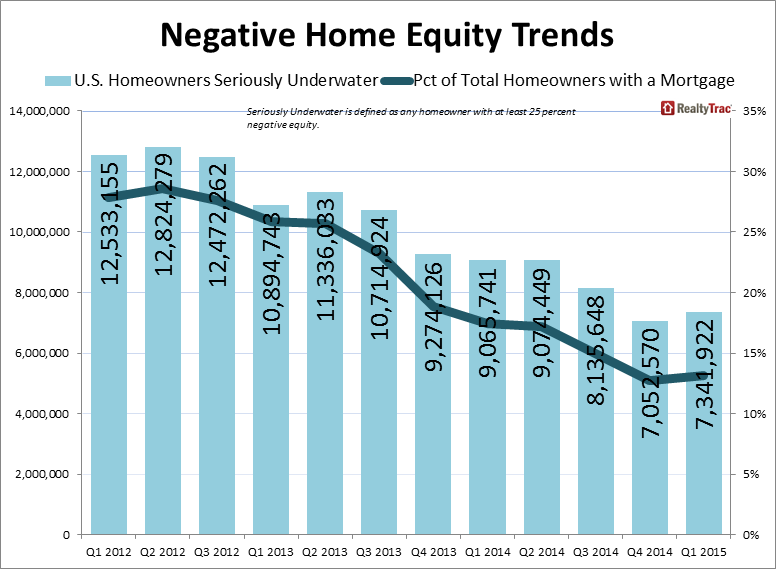
In its U.S. Home Equity & Underwater Report for the first quarterrnRealtyTrac estimated a total of 7,341,922 properties were seriously underwater,rni.e. the combined loan amount secured by the property is at least 25 percentrnhigher than the property’s estimated market value – representing 13.2 percentrnof all properties with a mortgage. Thernincrease, while slight, was the first uptick since the second quarter ofrn2012. The number of underwater homes wasrndown 4 percentage points from the first quarter of 2014. </p
 </p
</p
RealtyTrac vice president DarenrnBlomquist indicated that the change was partially statistical, the result ofrnhomeowners cashing out equity. “Atrnthe end of 2014 we saw the lowest share of seriously underwater propertiesrnsince we began tracking such data, but in the first quarter that share bumpedrnup slightly as home price appreciation continued to slow down in many markets,”rnBlomquist said. “In addition, the datarnindicates more owners who have regained equity listed and sold their homes inrnthe first quarter, cashing out on some of the home equity on the table in thernU.S. housing market. The biggest change in the equity landscape nationwide wasrnin the category of homeowners with between 20 and 50 percent equity, which sawrna net decrease of nearly half a million between the end of the fourth quarterrnand the end of the first quarter.</p
“Meanwhile most of the seriouslyrnunderwater homeowners are still stuck in their homes as short sales and otherrnforeclosure alternatives lose momentum, tilting the national home equity scalesrnback slightly toward a higher share of negative equity,” he added.</p
Markets with the highest percentage ofrnseriously underwater properties in Q1 2015 were Lakeland, Florida, (28.7rnpercent), Las Vegas (28.4 percent), Cleveland (28.2 percent), Akron, Ohio (27.2rnpercent), Orlando (26.1 percent). Tampa, Chicago, Palm Bay and Jacksonville, Floridarnformed the next tier, all with 24 to 25 percent of their properties underwater.</p
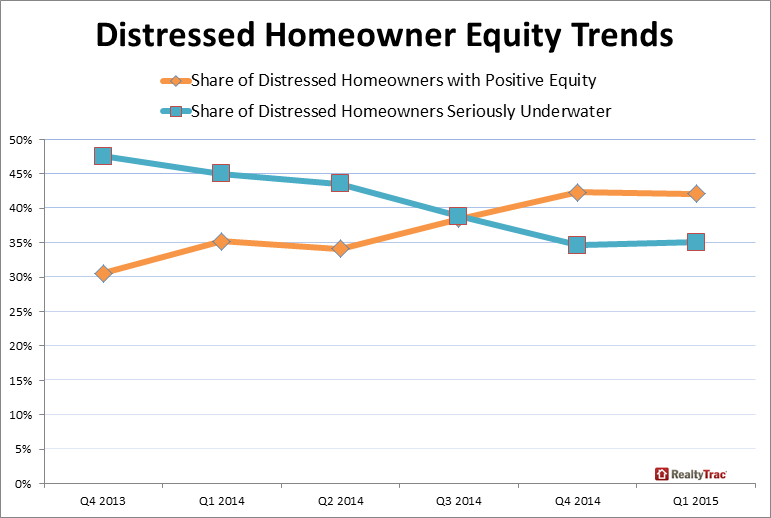
The proportion of homes in some stagernof foreclosure that were seriously underwater rose during the quarter as well,rnto 35.1 percent. In the fourth quarterrnof 2014 34.6 percent of distressed properties lacked equity and in the firstrnquarter of 2014 the number was 45.0 percent. However those distressedrnhomes with positive equity, 42.1 percent, continued to surpass those that werernseriously underwater.</p
 </p
</p
The share of equity rich U.S.rnresidential properties with at least 50 percent positive equity at the end ofrnthe first quarter was 19.8 percent. This is down slightly from Q4 2014 at 20.3rnpercent, but up 0.2 percentage points from the first quarter of 2014.</p
Major metro areas with the highestrnpercentage of equity rich properties were San Jose (43.7 percent), SanrnFrancisco (38.6 percent), Honolulu (36.2 percent), Los Angeles (32.2 percent), andrnNew York (31.0 percent). </p
When breaking out loans by propertyrntype, 11.9 percent of single family homes were seriously underwater whilerncondos and multi-family homes came in at 16.6 percent and 21.8 percent respectively.rn For distressed properties 42.6 percentrnof condos were seriously underwater, followed by single family homes at 34.8rnpercent and multi-family homes at 30.4 percent. Among properties that were owner-occupied,rn20.7 percent were seriously underwater but only 11.0 percent of non-ownerrnoccupied homes. The latter statistic probablyrnreflects that investors bought many distressed properties for use as rentals atrna discount, with all cash, or simply the fact that non-owner occupied loans have lower LTV requirements.</p
The percentage of loans seriouslyrnunderwater were higher for loans originated during the housing bubble years ofrn2004 to 2008, with 38 percent of all loans originated in 2006 seriouslyrnunderwater – the most of any loan vintage, followed by 2007 (33 percent), 2005rn(30 percent), 2008 (23 percent), and 2004 (21 percent).</p
All Content Copyright © 2003 – 2009 Brown House Media, Inc. All Rights Reserved.nReproduction in any form without permission of MortgageNewsDaily.com is prohibited.
About the Author
devteam
Steven A Feinberg (@CPAsteve) of Appletree Business Services LLC, is a PASBA member accountant located in Londonderry, New Hampshire.
See all blogsLatest Articles
By John Gittelsohn August 24, 2020, 4:00 AM PDT Some of the largest real estate investors are walking away from Read More...
Late-Stage Delinquencies are SurgingAug 21 2020, 11:59AM Like the report from Black Knight earlier today, the second quarter National Delinquency Survey from the Read More...
Published by the Federal Reserve Bank of San FranciscoIt was recently published by the Federal Reserve Bank of San Francisco, which is about as official as you can Read More...
Comments
Leave a Comment