
Blog

Company Outlines Model behind New Housing Derivative
The Chicago Board Options Exchangern(CBOE) will soon permit futures trading in housing through a derivative basedrnon the Radar Logic Composite Price. rnAccording to information released by Radar Logic, a New York City realrnestate data and analytics company, this derivative will allow institutions bothrnto hedge against downturns in housing prices and to allocate portions of theirrninvestment portfolios to housing assets without the search, transaction, andrnmaintenance costs association with purchasing physical properties. Or, as the background information the companyrnreleased today says, “RPX futures will allow you to invest in residential realrnestate without having to mow the lawn.”</p
It is not our purpose to assist RadarrnLogic in its promotional campaign nor is this intended as a discussion of thernappropriateness of encouraging further speculation in the housing marketrnalthough that discussion could be a worthy one. However, the “RPX Housing Market Review”rnreleased by the company last week does explain the methodology underlyingrncalculation of the Radar Logic Composite Price and provides a context forrnanyone who is interested in following this new market. </p
This is not the first such venture intornhousing derivatives. In the fall ofrn2007, Radar Logic helped launch a market for a privately traded product whichrnreached $4 billion in 14 months. Thernsubsequent housing bust demonstrated that values can decline nationwide inrnunison and presenting investors with additional motivation to hedge againstrndownturns in values.</p
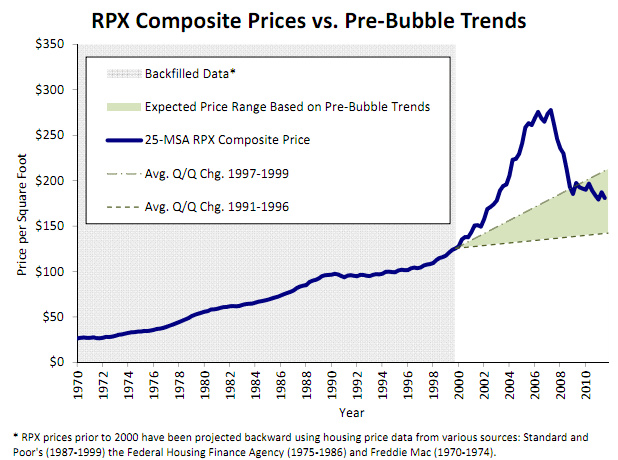
Home prices are now in a range thatrnwould have been expected absent the boom and bust of the last decade. As a test of its model, the RPX figures whichrndate back to 2000 have been augmented with housing data from S&P, thernFederal Housing Finance Agency, and Freddie Mac. From 1991 through 1996 housing was in thernworst slump in 20 years and price increases were at a very slow pace. During this period RPX Composite pricesrnincreased just $0.35 per quarter compared to the average of $.83 from 1970 torn1999. This rate was used to calculaternthe pessimistic scenario for home prices over the 2000 to 2011 period. For the optimistic scenario the designersrnused the average quarter-over-quarter growth rate from 1997 through 1999 whenrnthe tech bubble ended the stagnation of the preceding six years and thernComposite grew at an average quarterly rate of $1.82. </p
Using the pessimistic scenario tornproject growth over the 11 year period since 2000 would have resulted in arncomposite of $142 per square foot (psf) as of September 30, 2011, 27 percentrnlower than the actual value. Using thernoptimistic scenario, the projection would have been $213 psf, 18 percent abovernactual value. “Back in early 2000,” thernreview says, “most housing market observers would have expected housing valuesrnto grow at somewhere between the rates in these scenarios. Home values, as measured by the RPX Compositernprice, are now within this range.”</p
 </p
</p
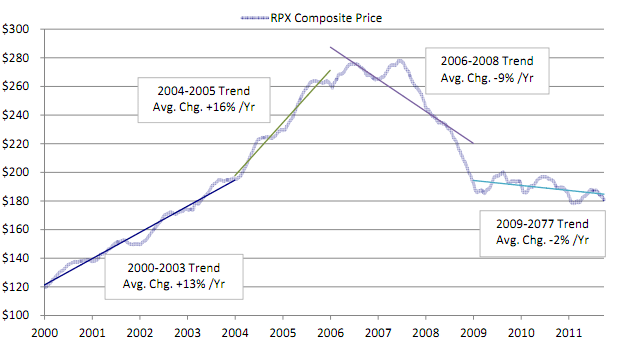
As of January 31, 2000, the 28â€day RPX Compositernprice was $121.96 per square foot. By December 31, 2005, it had increased torn$261.21 per square foot, reflecting a 13 percent average annual growth raternfrom 2000 through 2003 and a 16 percent average annual growth rate from 2004rnthrough 2005 (Figure 2). The 28â€dayrnRPX Composite price peaked at $278.32 on June 8, 2007, 109% greater than itsrnvalue seven years prior. In other words, housing values doubled in less thanrnseven years. </p
This growth resulted from severalrnfactors. An extended period of very lowrninterest rates was instituted by the Federal Reserve to spur the economy afterrnthe 2011 recession. This was bad forrnfixed-income investors and they went searching for new investments with higherrnreturns, overwhelmingly choosing U.S. mortgage debt through mortgage backedrnsecurities. This sparked the pursuit ofrnmore and more loans, leading to lower mortgage standards, increased demand forrnhousing purchases and rising prices. rnThis then led to riskier loans, increased defaults, a glut ofrnforeclosures, falling prices, etc.</p
 </p
</p
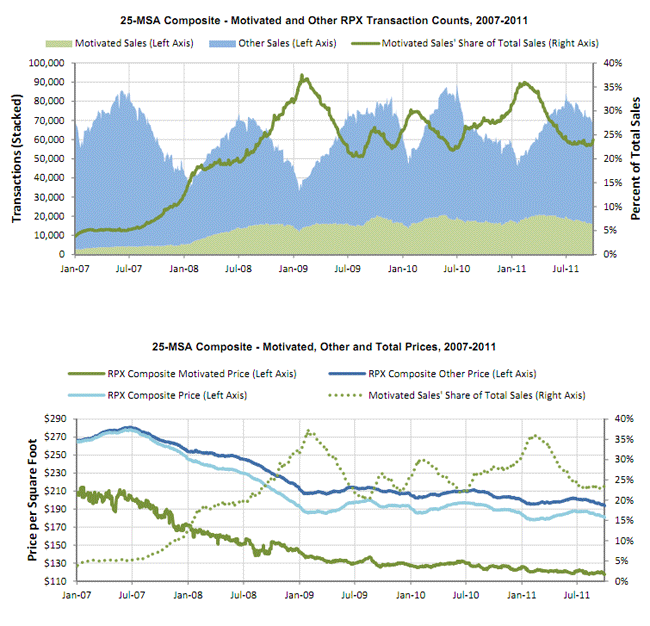
Sales at auctions and through lenders,rni.e. “motivated sales” resulted in substantial price discounts and rapidrnfalling of the RPX Composite price in 2007 and 2008 and these sales stillrnremain a significant percentage of sales, seasonally ranging between 20 and 38rnpercent. </p
 </p
</p
According to Radar Logic, home pricesrnhave fallen back to about where we would expect them to be given preâ€bubble growthrnrates. </p<ul<li Home prices have dropped to the pointrnwhere some institutional investors see portfolios of distressed properties asrnattractive investments. Demand from such investors has helped stabilize homernprices. </li<li Inventories are slowly decreasing,rnincluding distressed inventories in nonâ€judicialrnforeclosure states and new home construction is down. </li<li Housing is now cheap relative to otherrntradable asset classes. In historical perspective, housing is cheaper thanrngold, which is just slightly off its allâ€timernhigh. Housing is also cheap relative to bonds, as bond prices have been drivenrnupward by the impact of public policy.</li</ul
Therncompany feels “as the largest asset class there is, housing represents anrninvestment for which everyone should consider an allocation.” Wernleave that decision to you.
All Content Copyright © 2003 – 2009 Brown House Media, Inc. All Rights Reserved.nReproduction in any form without permission of MortgageNewsDaily.com is prohibited.
About the Author
devteam
Steven A Feinberg (@CPAsteve) of Appletree Business Services LLC, is a PASBA member accountant located in Londonderry, New Hampshire.
See all blogsLatest Articles
By John Gittelsohn August 24, 2020, 4:00 AM PDT Some of the largest real estate investors are walking away from Read More...
Late-Stage Delinquencies are SurgingAug 21 2020, 11:59AM Like the report from Black Knight earlier today, the second quarter National Delinquency Survey from the Read More...
Published by the Federal Reserve Bank of San FranciscoIt was recently published by the Federal Reserve Bank of San Francisco, which is about as official as you can Read More...
Comments
Leave a Comment