
Blog

CoreLogic: 10.9 Million Borrowers are Underwater
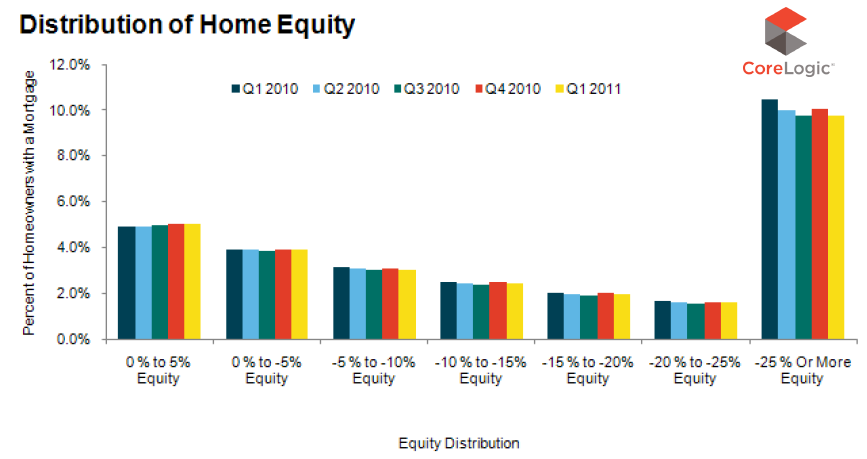
Approximately 22.7 percent of all U.S. homeowners were in a negative equity position with their mortgages at the end ofrnthe first quarter of 2011, down slightly from 23.1 percent in the fourthrnquarter of 2010. </p
In a report releasedrnTuesday, CoreLogic states that some 10.9 million borrowers are “underwater”,rni.e. owe more on their mortgages than their property is worth and another 2.5rnmillion borrowers (5 percent) were in a near-negative equity position, which thernreal estate data and analytics company defines as having less than 5 percentrnpositive equity. </p
While the drop in housing prices caused much of thernnegative equity, equity extraction was also a key driver. Borrowers with second mortgages on their homernwere twice as likely to suffer negative equity as those with only one lien. 18 percent of borrowersrnwithout home equity loans were underwater while 38 percent of borrowers with home equity loansrnwere in a negative position. A total ofrn4.5 million negative equity borrowers (40 percent) have home equity or otherrnjunior liens. </p
The current CoreLogic report does not attach a totalrndollar value to negative equity statistics but an analysis of the distribution ofrnnegative equity based on fourth-quarter 2010 numbers was published by therncompany last month which put the aggregate national net equity at $750rnbillion. The percentage of underwaterrnborrowers has declined only 4 basis points since that time. </p
 </p
</p
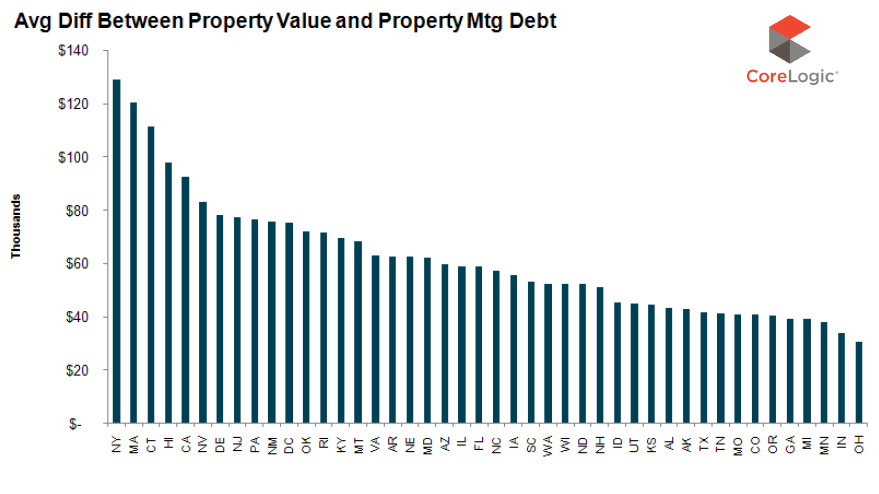
The negative position of individual borrowers is significant. The average underwaterrnborrower owes $65,000 more than his property is worth. This number varies widely by state from a lowrnof $31,000 in Ohio to $129,000 in New York. rnNot surprisingly, states that were among those with the biggest housingrnbooms now report the largest negative equity averages; Massachusetts, $120,000;rnConnecticut ($111,000), Hawaii ($98,000), and California ($93,000). States which saw the smallest run-up ofrnprices also have the lowest negative averages. rnIn addition to Ohio those states are Indiana ($34,000) and Minnesotarn($38,000.)*</p
 </p
</p
Going back again to the May report on negative equityrndistribution, CoreLogic found that the $750 billion in negative equity thatrnexisted in the fourth quarter was distributed fairly evenly between propertiesrnwith only one lien ($355 billion) and those with one or more junior liens ($395rnbillion). However, over 38 percent ofrnfirst-lien only negative equity ($135 billion) was in properties valued betweenrn$100,000 and $200,000 as opposed to properties with more than one lien ($95rnbillion or 26 percent). At the higherrnend, 39 percent ($154 billion) of negative equity properties in the $300,000 torn$700,000 range had multiple liens while 26 percent ($91 billion) had onlyrnone. In Q1 2011, the average negative equity for anrnindividual with only one mortgage was $52,000 while a negative equity borrower withrna 2nd lien was underwater by an average of $83,000.</p
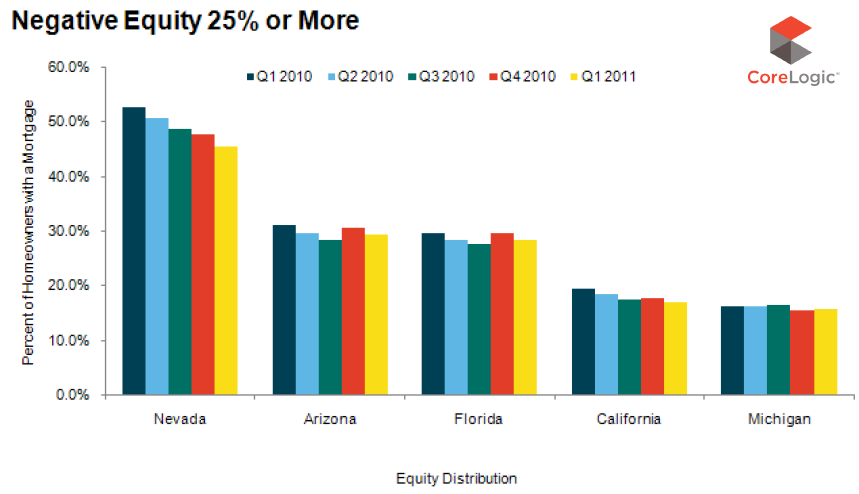
The states with the largest percentage of underwaterrnborrowers were Nevada (63 percent), Arizona (50 percent), Florida (46 percent),rnMichigan (36 percent) and California (31 percent). These states account for a 40 percent sharernof the net negative equity and then they are excluded from the nationalrnfigures, the percentage of underwater properties drops from 22.7 percent to 16rnpercent. The three hardest hit statesrndid show slight improvement from the fourth quarter of 2010; Nevada was downrn2.7 percentage points, Arizona fell 1.3 percentage points and Florida 1.3rnpercentage points.</p
 </p
</p
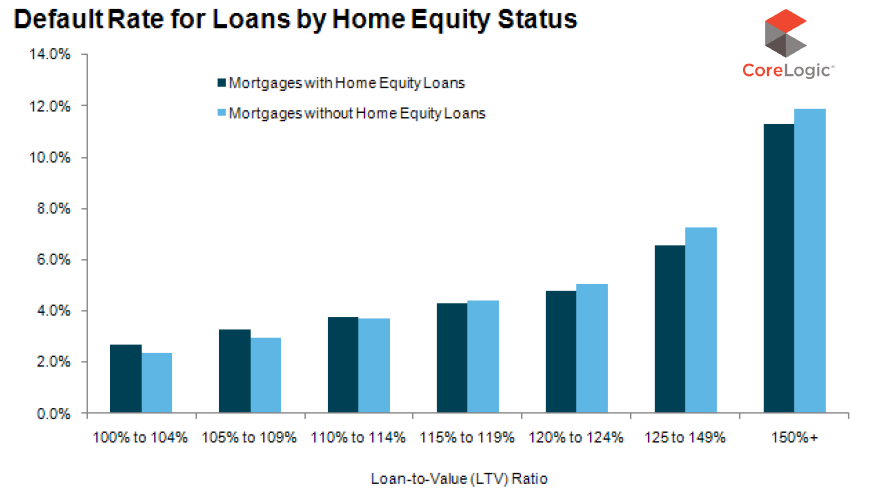
Default rates rise with the level of negativernequity but not necessarily with the number of outstanding loans. At a low level – a CLTV under 5 percent – therndefault rate is slightly above 2 percent with multi-lien properties defaultingrnat a slightly higher rate than single lien properties. Above the 115 percent CLTV level where therndefault rate is 4 percent, single lien properties begin to default at arnfractionally higher rate than multiple lien properties. Once the CLTV reaches 125 percent the defaultrnrate soars, reaching 12 percent at 150+ percent CLTV with single lienrnproperties marginally higher than those with multiple liens. </p
 </p
</p
“Many borrowers in negative equity are still ablernand willing to make their mortgage payments, Mark Fleming, CoreLogic’s chiefrneconomist said. “Those in negativernequity and impacted by an income shock of some kind, such as a job loss,rndivorce, or death, are much more likely to be at risk of foreclosure or a shortrnsale. The current economic indicatorsrnpoint to slow yet positive economic growth, which will slowly reduce the riskrnof borrowers experiencing income shocks. rnYet the existence of negative equity for the foreseeable future willrnweigh on the housing market recovery by holding back sale and refinancernactivity.” </p
“This data is certainly cause for concern”, says MND’s Managing Editor Adam Quinones. “If home prices continue to fall, we’ll be looking at another wave of strategic defaults”.</p
READ MORE: Strategic Default: Inconceivable Assumptions Suddenly Conceivable </p
*Individual data was not given for seven states;rnLouisiana, Maine, Mississippi, South Dakota, Vermont, West Virginia, andrnWyoming. We assume those states are alsornnot included in aggregate national numbers. rn</p
All Content Copyright © 2003 – 2009 Brown House Media, Inc. All Rights Reserved.nReproduction in any form without permission of MortgageNewsDaily.com is prohibited.
About the Author
devteam
Steven A Feinberg (@CPAsteve) of Appletree Business Services LLC, is a PASBA member accountant located in Londonderry, New Hampshire.
See all blogsLatest Articles
By John Gittelsohn August 24, 2020, 4:00 AM PDT Some of the largest real estate investors are walking away from Read More...
Late-Stage Delinquencies are SurgingAug 21 2020, 11:59AM Like the report from Black Knight earlier today, the second quarter National Delinquency Survey from the Read More...
Published by the Federal Reserve Bank of San FranciscoIt was recently published by the Federal Reserve Bank of San Francisco, which is about as official as you can Read More...
Comments
Leave a Comment