
Blog

CoreLogic: Home Prices Increased on Monthly and Annual Basis, Trend to Continue
CoreLogic is reporting that home prices, including sales ofrndistressed homes, increased on both a monthly and annual basis in April. The company’s Home Price Index (HPI) increasedrnof 2.2 percent compared to March which marked the second straight month for anrnincrease. Prices were 1.1 percent higherrnthan in April 2011, the second straight improvement for that metric as well,rnthe first time that has happened since June 2010.</p
When distressed sales, both sales of bank-owned real estatern(REO) and short sales, are excluded from the calculations, prices were up 2.6rnpercent compared to March and this was the third consecutive monthly increase. The annual increase for this set of figuresrnwas 1.9 percent.</p
CoreLogic initiated a new measure of pricing with the Aprilrnreport; a pending HPI that will project price trends. The pending HPI for April indicates anotherrn2.0 percent increase from April to May. rnThis new metric is based on Multiple Listing Service (MLS) data thatrnmeasure price changes in the most recent month. </p
From the peak pricing seenrnin April 2006, the national index for all home prices has fallen 31.7 percent. When distressed transactions are excluded, the peak-to-current change was 23.3 percent. Therngreatest losses (including distressed properties) have been in Nevada (-58.9 percent), Florida (-46.5 percent),rnArizona (-46.5 percent), Michigan (-43.6 percent) and California (-41.0rnpercent).</p
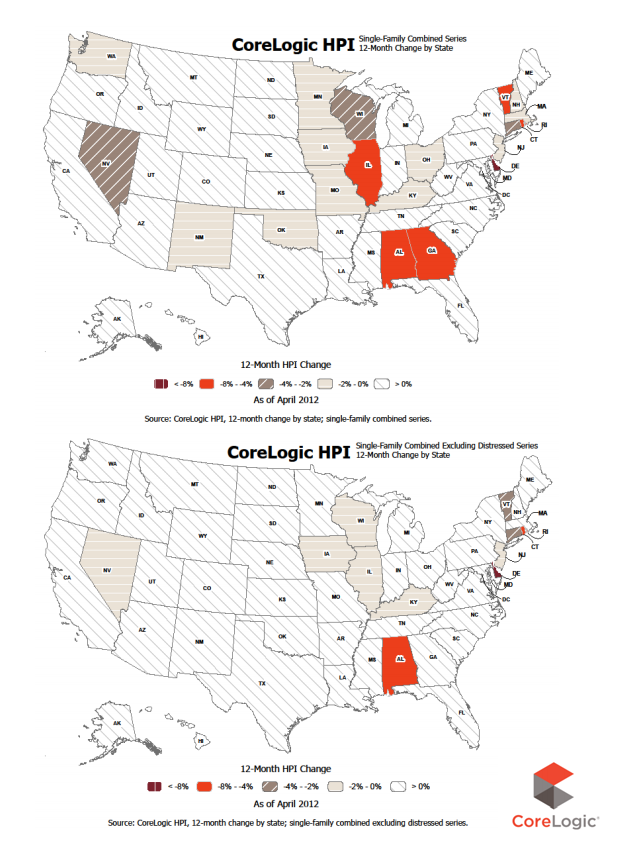
The states with the greatest increase in home pricesrnincluding distressed sales were Arizona (+8.8 percent), the District ofrnColumbia (+6.4 percent), and Florida (+5.5 percent.) Montana and Utah each had increases of 5.4rnpercent.</p
When distressed sales were eliminated the greatestrnappreciation was seen in Utah (+5.3 percent), Idaho (+5.1 percent), Mississippirn(+4.7 percent) and Louisiana and Arizona (+4.6 percent each.) </p
Prices are still dropping in a lot of states includingrnDelaware (-11.9 percent), Illinois (-6.8 percent), Alabama (-6.6 percent) andrnRhode Island (-6.2 percent). Thesernfigures included distressed sales. Whenrndistressed sales are not included Delaware still had a major loss of 10.1rnpercent followed by Rhode Island (-6.2 percent), and Alabama (-4.4 percent.) </p
Of the toprn100 Core Based Statistical Areas (CBSAs) measured by population, 44 are showingrnyear-over-year declines in April, 10 fewer than in March. </p
“We see the consistentrnmonth-over-month increases within our HPI and Pending HPI as one sign that thernhousing market is stabilizing,” said Anand Nallathambi, president and chiefrnexecutive officer of CoreLogic. “Home prices are responding to a restrictedrnsupply that will likely exist for some time to come-an optimistic sign for thernfuture of our industry.”</p
“Excluding distressed sales, home prices in March and Aprilrnare improving at a rate not seen since late 2006 and appreciating at a fasterrnrate than during the tax-credit boomlet in 2010,” said Mark Fleming, chiefrneconomist for CoreLogic. “Nationally,rnthe supply of homes in current inventory is down to 6.5 months, a level notrnseen in more than five years, in part driven by the ‘locked in’ position of sornmany homeowners in negative equity.”</p
All Content Copyright © 2003 – 2009 Brown House Media, Inc. All Rights Reserved.nReproduction in any form without permission of MortgageNewsDaily.com is prohibited.
About the Author
devteam
Steven A Feinberg (@CPAsteve) of Appletree Business Services LLC, is a PASBA member accountant located in Londonderry, New Hampshire.
See all blogsLatest Articles
By John Gittelsohn August 24, 2020, 4:00 AM PDT Some of the largest real estate investors are walking away from Read More...
Late-Stage Delinquencies are SurgingAug 21 2020, 11:59AM Like the report from Black Knight earlier today, the second quarter National Delinquency Survey from the Read More...
Published by the Federal Reserve Bank of San FranciscoIt was recently published by the Federal Reserve Bank of San Francisco, which is about as official as you can Read More...
Comments
Leave a Comment