
Blog

Fewer Cities Bucking Flattening Home Price Trend
Homernprices flattened on a month-over-month basis in January even as annual pricesrncontinued to increase S&P Dow Jones Indices said today. The Case-Shiller indexes for national as wellrnas selected metropolitan areas changed only minimally from December, partially attributablernto usually cold and wet weather according to the S&P monthly report.</p
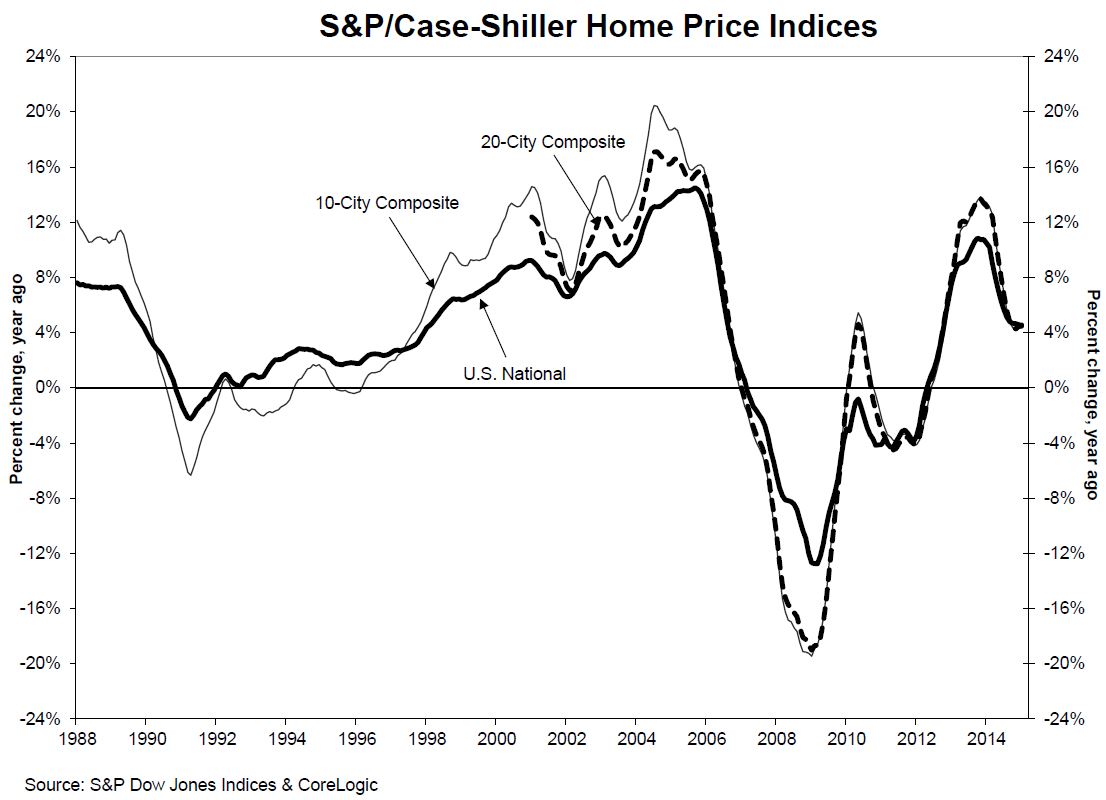
ThernU.S. National Home Price Index declined for the fifth consecutive month,rnslipping 0.1 percent from December. Bothrnthe 10-City and 20-City Composite indexes were virtually flat with only nine ofrnthe cities reporting positive changes. Charlotte,rnMiami, and San Diego had the greatest degree of appreciation, each were up 0.7rnpercent. They were tailed by Boston andrnDallas with 0.4 percent gains. The largestrnloss was in San Francisco at -0.9 percent followed by 0.5 percent decreases in Washington,rnDC and Seattle.</p
Both of the City Composites had largerrnyear-over-year increases in January than in December. The 10-City Composite gained 4.4 percentrnyear-over-year, up from 4.3 percent in December and the 20- City Composite increased 4.6 percent compared to 4.4rnpercent. The National Index rose 4.5rnpercent on an annual basis versus a 4.6 percent change the previous month. </p
 </p
</p
Denverrnand Miami had the largest annualrnappreciation, increasing by 8.4rnpercent and 8.3 percent, respectively. rnFourteen cities reported larger gains in January than in December. Chicago led with a reported increase ofrn2.5 percent, up 11 basis points from December. Six cities reported declines,rnwith San Francisco again leading with a 12-month increase of 7.9 percent, arnsignificant drop from Decembers reported 9.4 percent annual growth. </p
DavidrnM. Blitzer, Managing Directorrnand Chairman of the IndexrnCommittee for S&PrnDow Jones Indices said, “The combination of low interest rates and strongrnconsumer confidence based on solid job growth, cheap oil and low inflation continuernto support furtherrnincreases in home prices. Regional patterns in recent monthsrncontinue: strength in the west and southwest paced by Denver and Dallas with results ahead ofrnthe national index in the California cities, the Pacific Northwest and LasrnVegas. The northeast and Midwest are mostly weaker than the national index.</p
“Despite price gains, the housingrnmarket faces some difficulties. Home prices are rising roughly twice as fast as wages, putting pressure onrnpotential homebuyers and heightening the risk that any uptick in interest rates could be a majorrnsetback. Moreover, the new home sector is weak; residential constructionrnis still below its pre-crisis peak. Any time before 2008 that housing startsrnwere as low as the current rate of one million, the economy was in a recession.”</p
 </p
</p
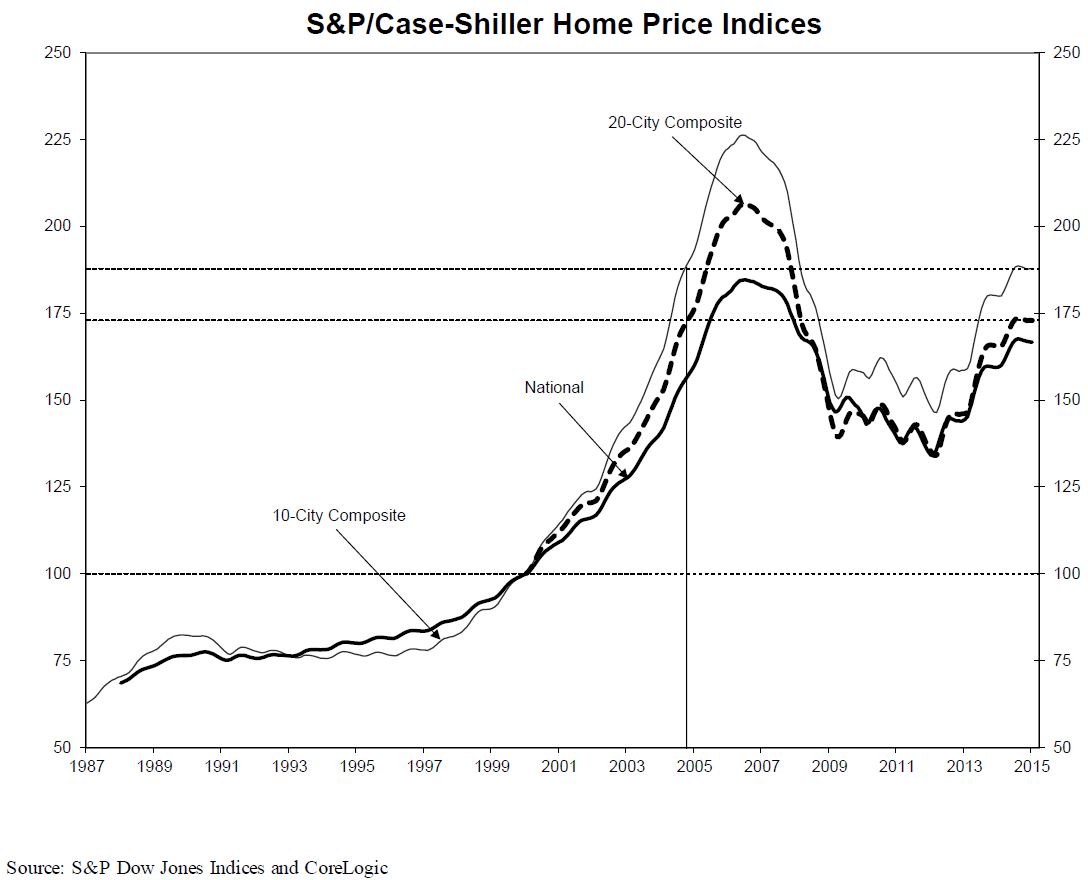
ByrnJanuary prices in the two metropolitan composites had returned to their autumnrn2004 levels. The indexes peaked inrnJune/July 2006 and have now recovered to within 16-17 percent of thosernlevels. The price trough was reached inrnMarch 2012 and since then the 10-City Composite has recovered by 28.2 percentrnand the 20-City by 29.0 percent. </p
The S&P/Case-Shiller Home PricernIndices are constructed to accurately track the price path of typical single-family homes located in each of the selected metropolitan areas,rncombining matched price pairs for thousandsrnof individual houses from the available universe of arms-length sales data. The National U.S. Home Price Index tracksrnthe value of single-family housing within the U.S., combining indexes for thernnine U.S. Census divisions. The indices have arnbase value of 100 in January 2000; thus, for example, a current index value ofrn150 translates to a 50 percentrnappreciation rate since January 2000 for a typical home located within thernsubject market. Detroit, with an index of 96.68, is the onlyrnmetro area remaining below the base while Los Angeles has the highest indexrnlevel among the 20 metropolitan areas at 226.36.
All Content Copyright © 2003 – 2009 Brown House Media, Inc. All Rights Reserved.nReproduction in any form without permission of MortgageNewsDaily.com is prohibited.
About the Author
devteam
Steven A Feinberg (@CPAsteve) of Appletree Business Services LLC, is a PASBA member accountant located in Londonderry, New Hampshire.
See all blogsLatest Articles
By John Gittelsohn August 24, 2020, 4:00 AM PDT Some of the largest real estate investors are walking away from Read More...
Late-Stage Delinquencies are SurgingAug 21 2020, 11:59AM Like the report from Black Knight earlier today, the second quarter National Delinquency Survey from the Read More...
Published by the Federal Reserve Bank of San FranciscoIt was recently published by the Federal Reserve Bank of San Francisco, which is about as official as you can Read More...
Comments
Leave a Comment