
Blog

Foreclosure Activity at Lowest Level in 5 Years; Severe Problems Continue in Some States
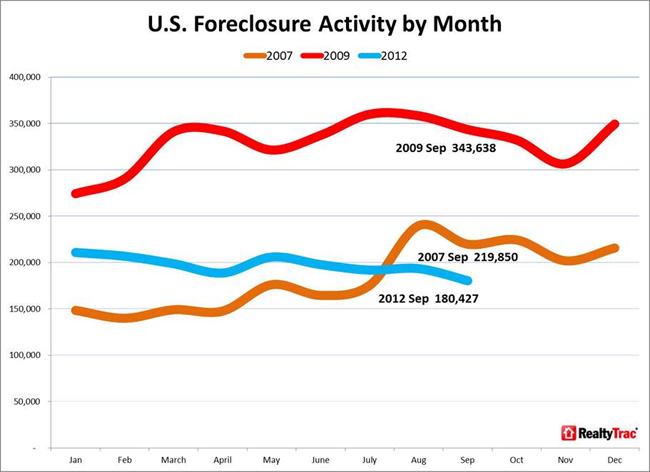
Foreclosurernactivity nationwide fell to the lowest level in September since almost thernbeginning of the foreclosure crisis according to RealtyTrac’s U.S. ForeclosurernMarket Report released this morning. Foreclosurernfilings fell 7 percent from the August level to a total of 180,427 or one inrnevery 730 housing units. The total is 16rnpercent below filings in September 2011 and the lowest since July 2007. </p
RealtyTrac is anrnIrvine, California firm that tracks three categories of foreclosure filingsrngathered from county level sources. </p<ol start="1" type="1"
RealtyTrac’s September reportrnincludes data on the third quarter and these numbers were the lowest since thernfourth quarter of 2007. During thernquarter there were filings on 531,576 U.S properties, a decrease of 5 percentrnfrom the second quarter and of 13 percent from the third quarter of 2011. This is the ninth consecutive quarter wherernoverall foreclosure activity dropped.</p
 </p
</p
NOD and LIS filings accounted forrnthe decrease in filings as later stage activity actually increased. These two early stage categories totaledrn56,148 for the month compared to 99,405 in August. There were 70,710 auctions scheduled for thernfirst time compared to 41,723 the previous month and bank repossessions rose torn53,569 from 52,380. </p
“We’ve been waiting for the otherrnforeclosure shoe to drop since late 2010, when questionable foreclosurernpractices slowed activity to a crawl in many areas, but that other shoe isrninstead being carefully lowered to the floor and therefore making little noisernin the housing market – at least at a national level,” said Daren Blomquist,rnvice president at RealtyTrac. “Make no mistake however; the other shoe isrndropping quite loudly in certain states, primarily those where foreclosurernactivity was held back the most last year. </p
“Meanwhile, several statesrnwhere the foreclosure flow was not so dammed up last year could see arnroller-coaster pattern in foreclosure activity going forward because of recentrnlegislation or court rulings that substantively change the rules to properlyrnforeclose,” Blomquist added. “A backlog of delayed foreclosures will likelyrnbuild up in those states as lenders adjust to the new rules, with many of thoserndelayed foreclosures eventually hitting down the road.”</p
 </p
</p
Whilernnumbers at the national level were encouraging severe problems continue in somernstates and in others they are actually increasing. The national decrease in September and the third quarter wererndriven mostly by sizable decreases in the non-judicial foreclosure states. Of thern24 non judicial states 20 reported annual decreases in foreclosure activity inrnthe third quarter, some quite substantial. For example, Nevada saw a decrease of 71 percent,rnOregon 63 percent, and Utah 60 percent.</p
Washington State was one of onlyrnfour non-judicial foreclosure states where foreclosure activity increased inrnthe third quarter, up 70 percent from the previous quarter and up 15 percentrnfrom the third quarter of 2011. This was one of the first non-judicial statesrnto enact legislation impacting the foreclosure process following the so-calledrnrobo-signing controversy that came to light in October 2010. The staternlegislature passed a law that took effect in July 2011, requiring lenders tornoffer mediation to homeowners facing foreclosure.</p
Meanwhile, third quarter foreclosurernactivity increased on a year-over-year basis in 14 out of the 26 judicialrnprocedure states. New Jersey, alreadyrnone of the most active states had a huge 130 percent increase, while New York sawrna jump of 53 percent in its already high rate. Indiana, Pennsylvania,rnConnecticut and Illinois all had increases of 31 to 36 percent </p
Among the exceptions where judicialrnstates had annual decreases in foreclosure activity in the third quarter includedrnMassachusetts (16 percent decrease) and Wisconsin (12 percent decrease). </p
Looking only at September figures, Floridarnforeclosure starts (LIS) in September increased 24 percent on a year-over-yearrnbasis, the 11th consecutive month with an annual increase, and thernstate’s foreclosure rate ranked highest nationwide for the first time sincernApril 2005.</p
On a quarterly basis the states withrnthe highest foreclosure rates were Florida (one in every 117 housing units),rnArizona (one in 125 units) and California (also one in 125). Other states ranked high for activity in thernthird quarter were Illinois, Georgia, Nevada, and Ohio. </p
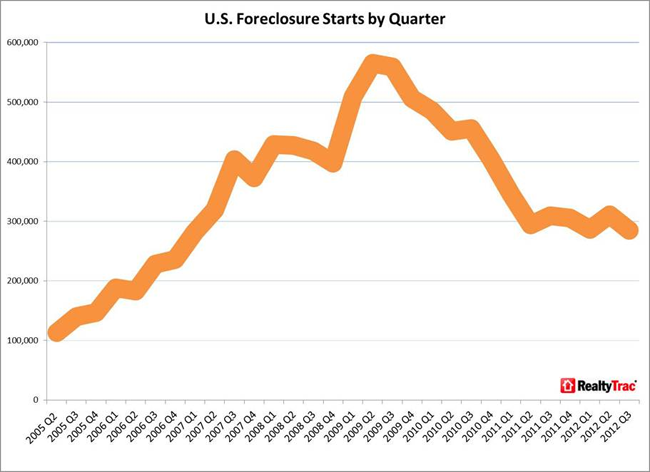
Days to foreclose increased to 382rndays in the third quarter, up from 378 days in Q2 and 336 days in the thirdrnquarter of 2011. Recent legislation andrncourt rulings have extended the foreclosure process in several states in additionrnto Washington noted above. Consequentlyrntime to foreclose increased 62 percent to 193 days in Oregon, 62 percent to 662rndays in Hawaii, and 42 percent to 520 days in Nevada.
All Content Copyright © 2003 – 2009 Brown House Media, Inc. All Rights Reserved.nReproduction in any form without permission of MortgageNewsDaily.com is prohibited.
About the Author
devteam
Steven A Feinberg (@CPAsteve) of Appletree Business Services LLC, is a PASBA member accountant located in Londonderry, New Hampshire.
See all blogsLatest Articles
By John Gittelsohn August 24, 2020, 4:00 AM PDT Some of the largest real estate investors are walking away from Read More...
Late-Stage Delinquencies are SurgingAug 21 2020, 11:59AM Like the report from Black Knight earlier today, the second quarter National Delinquency Survey from the Read More...
Published by the Federal Reserve Bank of San FranciscoIt was recently published by the Federal Reserve Bank of San Francisco, which is about as official as you can Read More...
Comments
Leave a Comment