
Blog

Foreclosures Plummeting Overall, but Some States Spiking
Thernfirst half of 2015 saw foreclosure activity continue to decline. RealtyTrac’s Midyear U.S. Foreclosure MarketrnReport shows that 597,589 properties received some type of foreclosure filingrnduring the six months ended in June. rnThis included default notices, scheduled auctions, and bankrnrepossessions or completed foreclosures. rnThe overall filing numbers are down 3 percent from the first half ofrn2014 and 13 percent lower than in the second half. </p
Foreclosure starts declined four percentrnfrom a year earlier to a total of 304,439, the lowest level in 10 years. The figure fell 18 percent below the peak of foreclosurernstarts in the first half of 2006, a period which pre-dated the housing crisis.</p
“U.S.rnforeclosure starts have not only returned to pre-housing crisis levels, theyrnhave fallen well below those pre-crisis levels and are still searching for arnfloor, down 4 percent from a year ago,” said Daren Blomquist, vice president atrnRealtyTrac. “Loans originated in the last five years continue to perform betterrnthan historic norms, with tighter lending standards and more cautious borrowerrnbehavior acting as important guardrails for the real estate boom of the pastrnthree years.”</p
 </p
</p
Bank repossessions however are stillrnwell above what might be considered normal. rnA total of 209,281 U.S. properties were repossessed by lenders in firstrnhalf of 2015, up 20 percent from a year ago and 37 percent above the number ofrnbank repossessions (REOs) in the first half of 2006 before the housing bubblernburst. Completed foreclosures also remain above 2006 levels in 35 states includingrnCalifornia, Florida, Arizona, Illinois and Nevada. </p
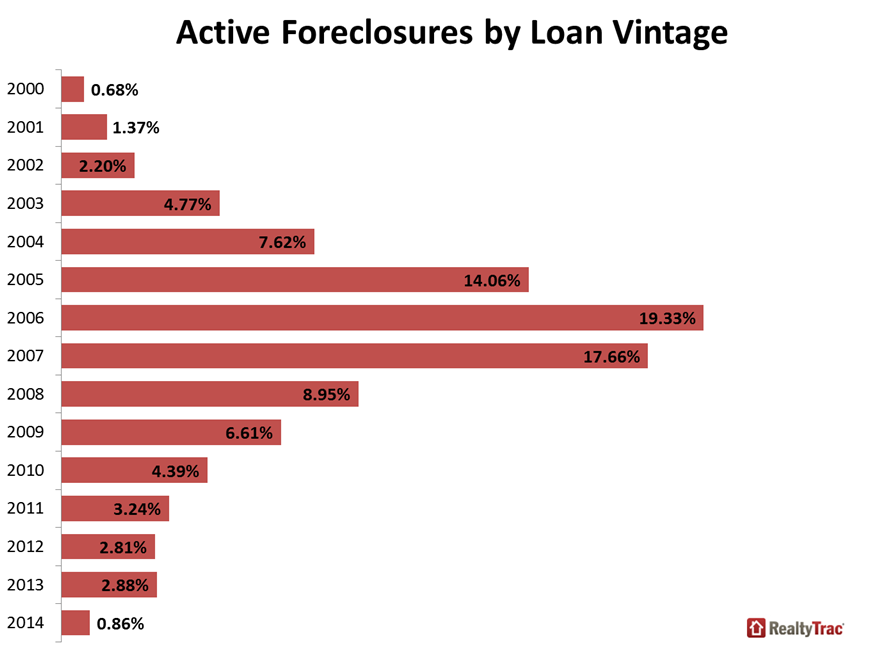
“Less-disciplined loans originatedrnduring the last housing boom continue to account for the majority of distressrnstill hanging over the housing market, with two-thirds of all loans inrnforeclosure on loans originated between 2004 and 2008,” Blomquist noted. “Anrnincreasing number of these failed bubble-era loans finally exited thernforeclosure process in the first half of 2015, resulting in accelerating bankrnrepossessions that are still well above pre-crisis levels along withrnrecord-long average foreclosure timelines for properties foreclosed in thernsecond quarter.”</p
The highest level of foreclosurernactivity in the country is still in Florida. rnWhile filings there were down 22 percent from a year earlier it stillrnhad a filing rate of 1.06 percent (one in every 95 properties) over the sixrnmonth period. </p
Activity is still increasing in NewrnJersey – up 24 percent from the same period in 2014. It has the second highest filing rate, 0.92rnpercent with one filing for every 109 properties. It was nearly matched by Maryland with only arnslightly lower rate after a 1 percent year-over-year decline.</p
Nevada‘s foreclosure activity increasedrn10 percent year-over-year and it had the fourth highest rate at 0.79 percentrn(one in 126). Illinois was fifth at 0.74rnpercent, one in every 135 units, despite its 9 percent annual improvement.</p
Foreclosure activity is stillrnincreasing in a number of states. rnFilings in Massachusetts rose by 43 percent on an annual basis; New Yorkrnand New Jersey were up by 31 and 24 percent respectively and Texas and Michiganrnby 21 and 17 percent. </p
Among metro areas the highest rate ofrnfilings was in Atlantic City, New Jersey at 1.70 percent of households. Eight of the remaining top ten areas were inrnFlorida, led by number two, Tampa, and number three Lakeland, followed byrnJacksonville and Ocala. Rockford,rnIllinois was the seventh on the list with a rate of 1.14 percent.</p
Eight of the 20 largest metro areas sawrnincreases in foreclosure activity compared to the previous year, most notablyrnBoston, up 29 percent, St. Louis (+25 percent), and New York (+24rnpercent). Dallas and Houston each postedrnincreases of 19 percent.</p
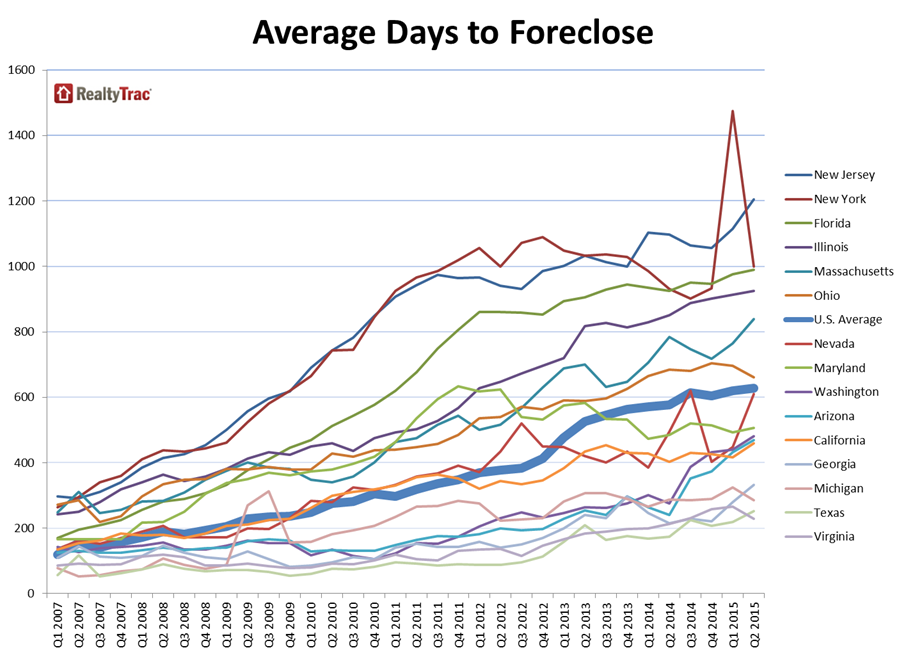
The time to complete a foreclosurerncontinued to increase, taking an average of 629 days from the first publicrnnotice of foreclosure to complete the process, the longest average time tornforeclose since RealtyTrac began tracking it in the first quarter of 2007. States with the longest foreclosure timelinesrnwere New Jersey (1,206), Hawaii (1,060), Montana (1,028), New York (1,000), andrnFlorida (989).</p
 </p
</p
The mid-year report also included datarnfor June. Briefly, total filingsrnnumbered 117,055 during that month, down 8 percent from May when activity hadrnsurged to a 19 month high, but still 9 percent above filings in June 2014. It was the fourth consecutive month with arnyear-over-year increase.</p
There were 49,105 foreclosure starts,rndown 4 percent from May but 4 percent higher on an annual basis. Completedrnforeclosures numbered 36,503 in June, a 19 percent drop from May but still uprn36 percent from a year ago, the fourth consecutive month with a year-over-yearrnincrease
All Content Copyright © 2003 – 2009 Brown House Media, Inc. All Rights Reserved.nReproduction in any form without permission of MortgageNewsDaily.com is prohibited.
About the Author
devteam
Steven A Feinberg (@CPAsteve) of Appletree Business Services LLC, is a PASBA member accountant located in Londonderry, New Hampshire.
See all blogsLatest Articles
By John Gittelsohn August 24, 2020, 4:00 AM PDT Some of the largest real estate investors are walking away from Read More...
Late-Stage Delinquencies are SurgingAug 21 2020, 11:59AM Like the report from Black Knight earlier today, the second quarter National Delinquency Survey from the Read More...
Published by the Federal Reserve Bank of San FranciscoIt was recently published by the Federal Reserve Bank of San Francisco, which is about as official as you can Read More...
Comments
Leave a Comment